Fig. 8.
Download original image
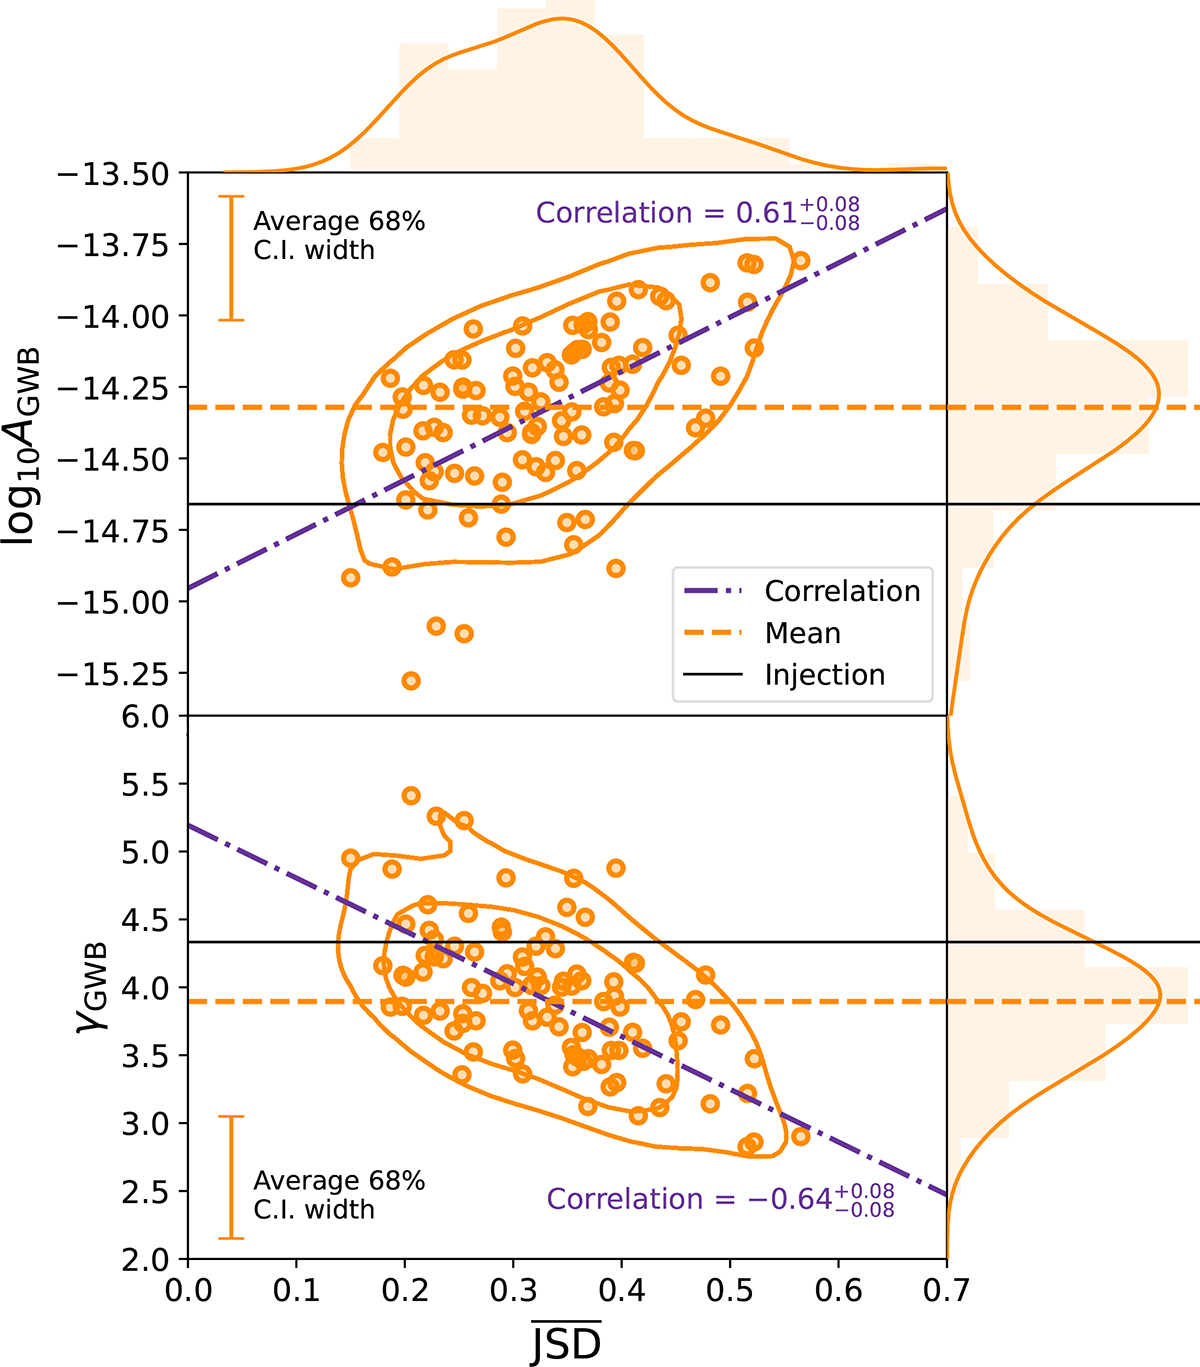
Weighted average JSD versus GWB amplitude (top panel) and the GWB slope (bottom panel) for the 100 simulated DR2full datasets. In each panel, dashed lines correspond to the mean of the distributions, dotted dashed lines are the eigen-diagonals of the distributions, showing a strong correlation between the weighted average JSD and the recovered value of the two GWB parameters. Black solid horizontal lines are the injected values (taking in mind that the signal injected has not a perfect power-law spectrum). The error bars represent the typical size of the 68% C.I. of the posterior distributions. Histograms and smoothed distributions on the top and right side of the plot represent the marginalised posterior distributions of the corresponding quantities.
Current usage metrics show cumulative count of Article Views (full-text article views including HTML views, PDF and ePub downloads, according to the available data) and Abstracts Views on Vision4Press platform.
Data correspond to usage on the plateform after 2015. The current usage metrics is available 48-96 hours after online publication and is updated daily on week days.
Initial download of the metrics may take a while.