Fig. 6.
Download original image
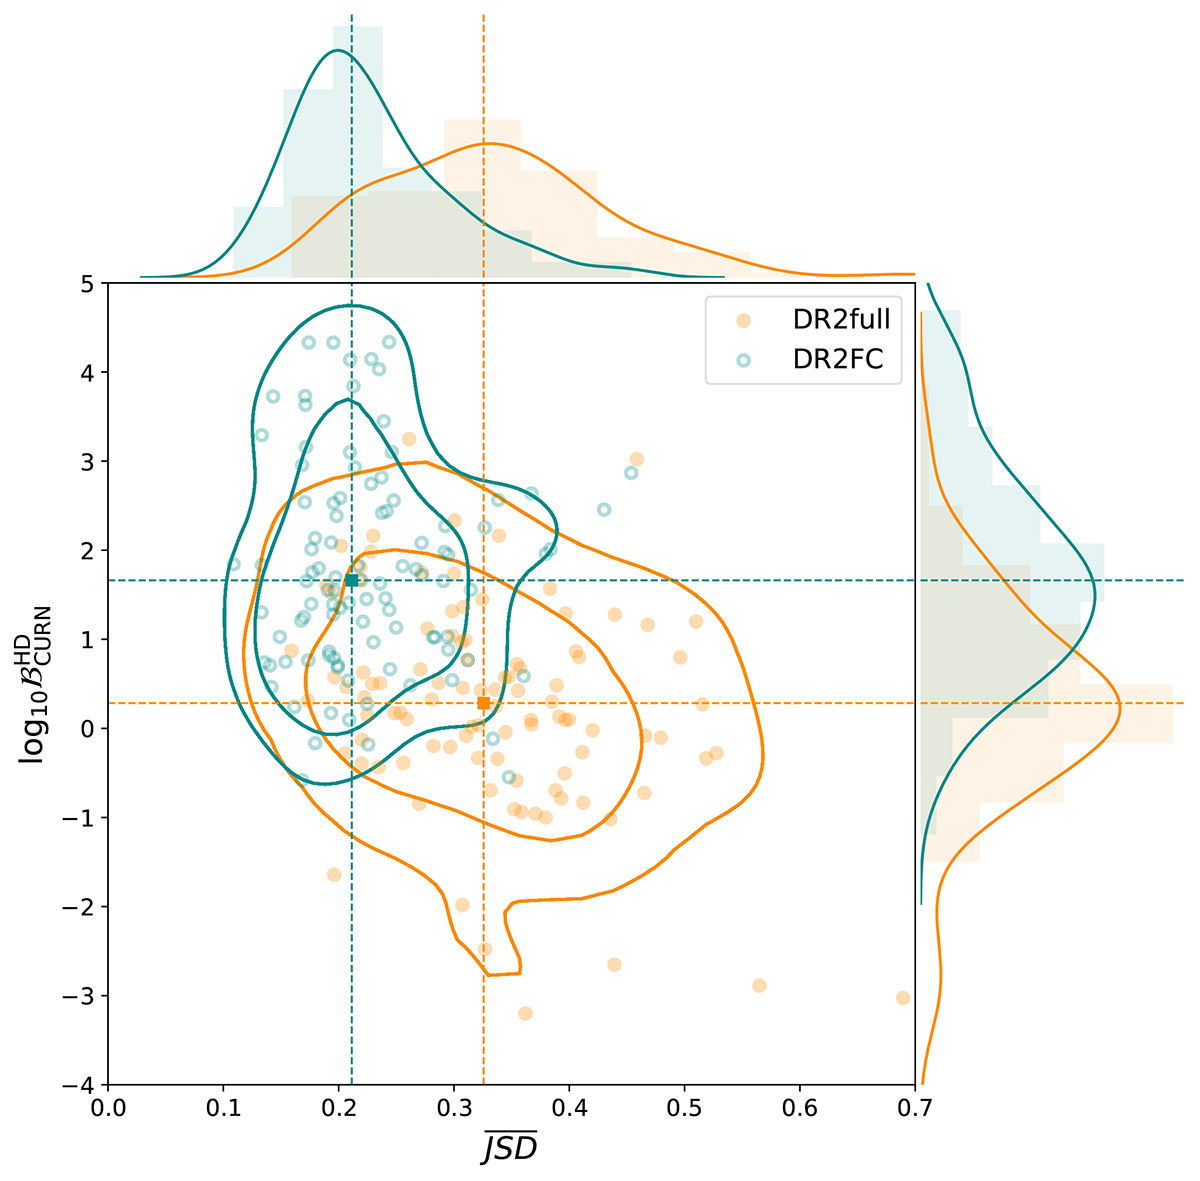
Scatter plot of the weighted average JSD (representing how degenerate the individual noise parameters are with the CRN parameters) versus log![]() . The orange points are the 100 realisations of DR2full-like datasets, the green points are the 100 realisations of DR2FC-like datasets. Contours represent 2D 68% and 90% C.I. Histograms and smoothed distributions on the top and right side of the plot represent marginalised distributions of
. The orange points are the 100 realisations of DR2full-like datasets, the green points are the 100 realisations of DR2FC-like datasets. Contours represent 2D 68% and 90% C.I. Histograms and smoothed distributions on the top and right side of the plot represent marginalised distributions of ![]() and log
and log![]() , respectively.
, respectively.
Current usage metrics show cumulative count of Article Views (full-text article views including HTML views, PDF and ePub downloads, according to the available data) and Abstracts Views on Vision4Press platform.
Data correspond to usage on the plateform after 2015. The current usage metrics is available 48-96 hours after online publication and is updated daily on week days.
Initial download of the metrics may take a while.