Fig. 3.
Download original image
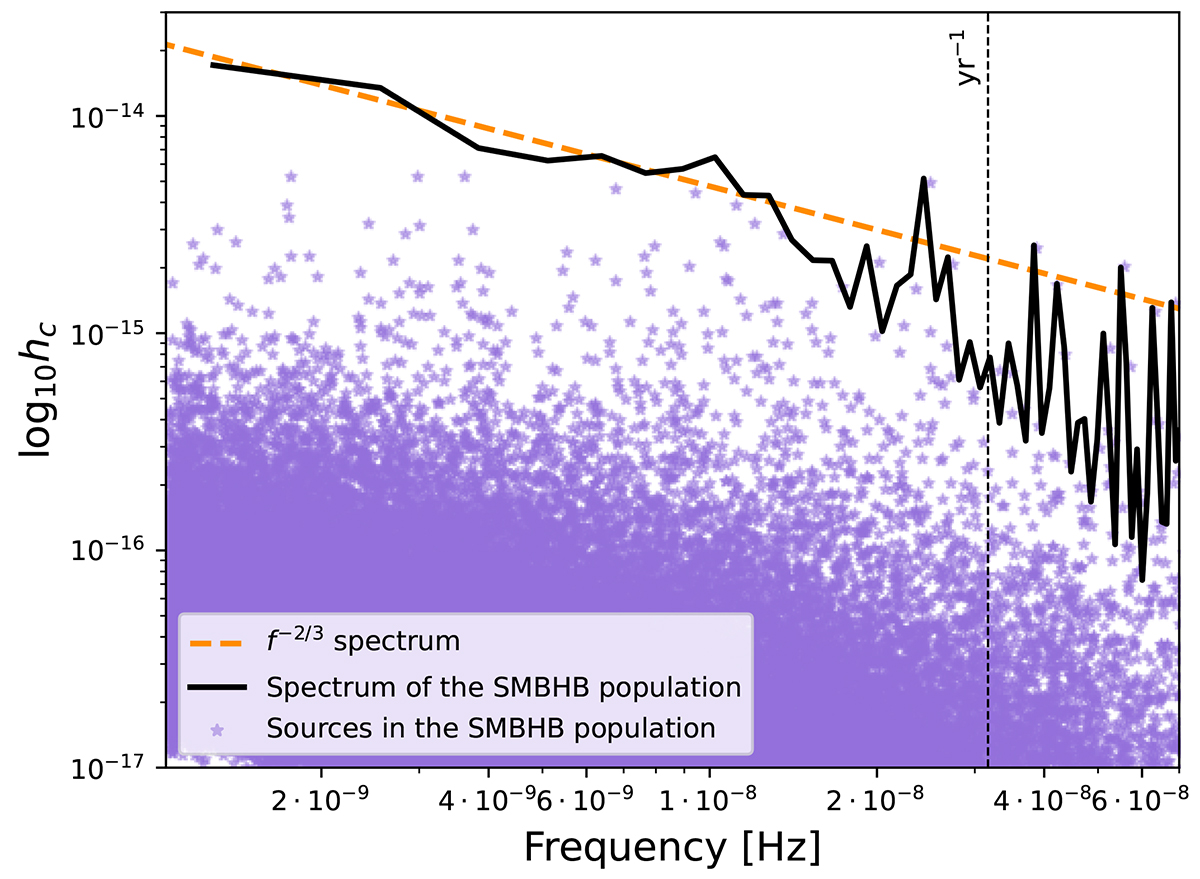
Characteristic strain spectrum of the injected GWB. Purple stars are the contributions to the spectrum of all the SMBHBs in the population. The black solid line is the total power spectrum in each frequency bin, where the frequency bins start at f = 1/Tobs and have width Δf = 1/Tobs with Tobs = 24.8 yr. As reference, the ideal spectrum with slope −2/3 and amplitude at the reference frequency of 1 yr−1AGW = 2.4 × 10⁻¹⁵ is shown by the dashed orange line.
Current usage metrics show cumulative count of Article Views (full-text article views including HTML views, PDF and ePub downloads, according to the available data) and Abstracts Views on Vision4Press platform.
Data correspond to usage on the plateform after 2015. The current usage metrics is available 48-96 hours after online publication and is updated daily on week days.
Initial download of the metrics may take a while.