Fig. A.3
Download original image
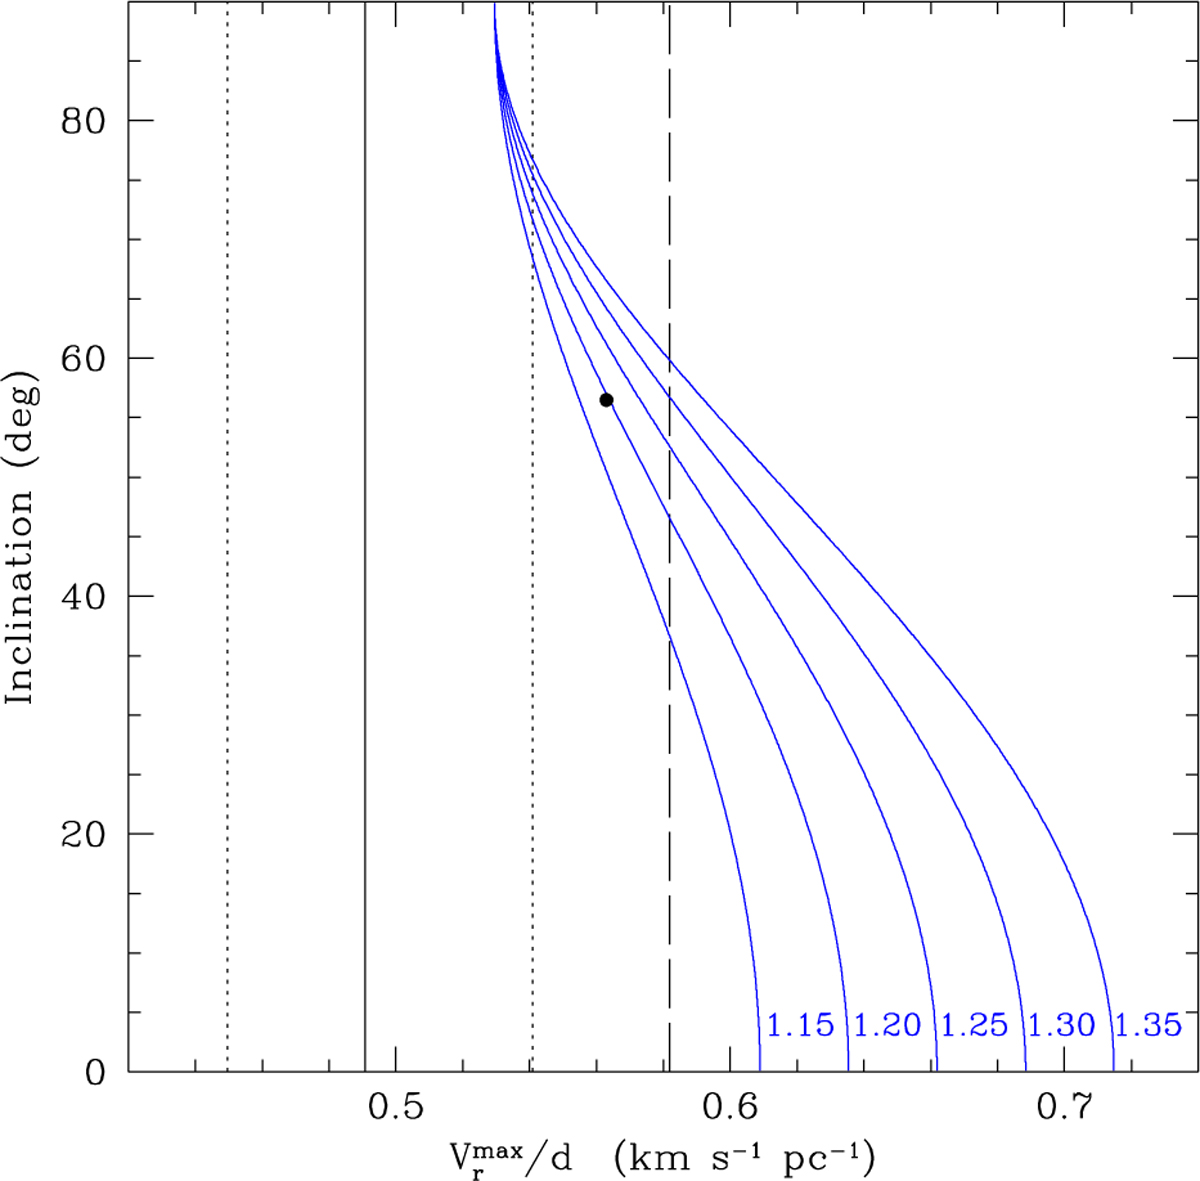
Variation of the ratio of the maximum systemic radial velocity to the distance of an ellipsoid for 5 different values of its ellipticity (labeled in blue) with its major axis inclination. The ratio between the observed maximum systemic radial velocity of FH Ser and its Gaia distance is marked by a solid vertical line, with 1-σ uncertainty marked by vertical dotted lines and the 2-σ lower uncertainty by a vertical dashed line. The black dot corresponds to the best fit value.
Current usage metrics show cumulative count of Article Views (full-text article views including HTML views, PDF and ePub downloads, according to the available data) and Abstracts Views on Vision4Press platform.
Data correspond to usage on the plateform after 2015. The current usage metrics is available 48-96 hours after online publication and is updated daily on week days.
Initial download of the metrics may take a while.