Fig. A.2
Download original image
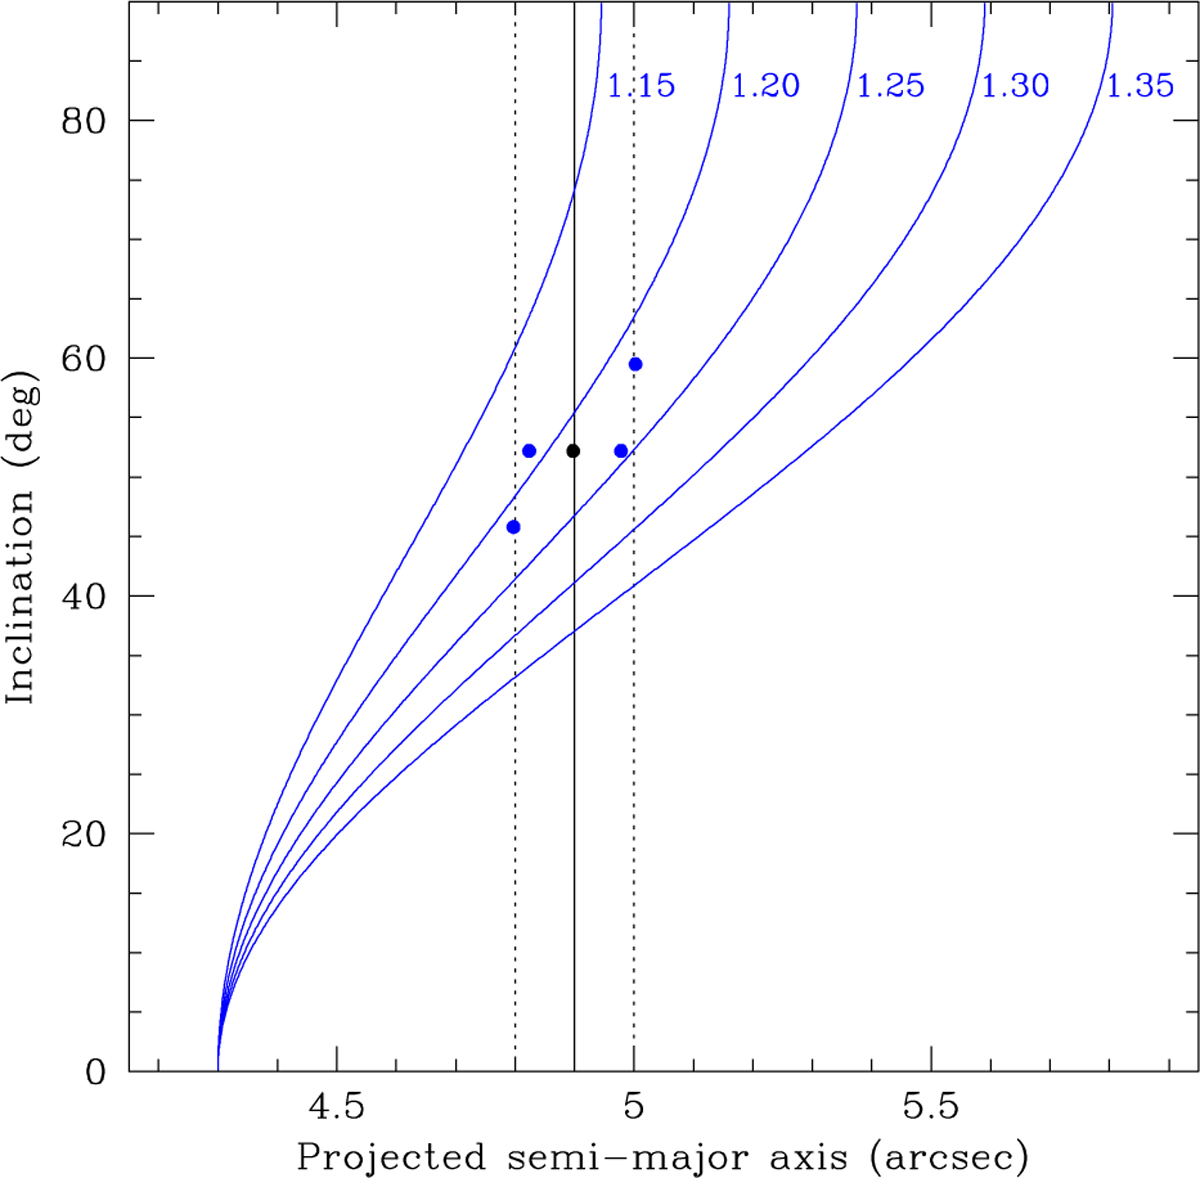
Variation of the projected semi-major axis of an ellipsoid along its symmetry axis for 5 different values of its ellipticity (labeled in blue) with its major axis inclination. The observed semi-major axis of 4.″9 of FH Ser is marked by a solid vertical line, with 1-σ uncertainty marked by vertical dotted lines. The black dot corresponds to the best fit value, with blue dots in the left and right panels representing acceptable values within the uncertainty of the observed parameters.
Current usage metrics show cumulative count of Article Views (full-text article views including HTML views, PDF and ePub downloads, according to the available data) and Abstracts Views on Vision4Press platform.
Data correspond to usage on the plateform after 2015. The current usage metrics is available 48-96 hours after online publication and is updated daily on week days.
Initial download of the metrics may take a while.