Fig. 6
Download original image
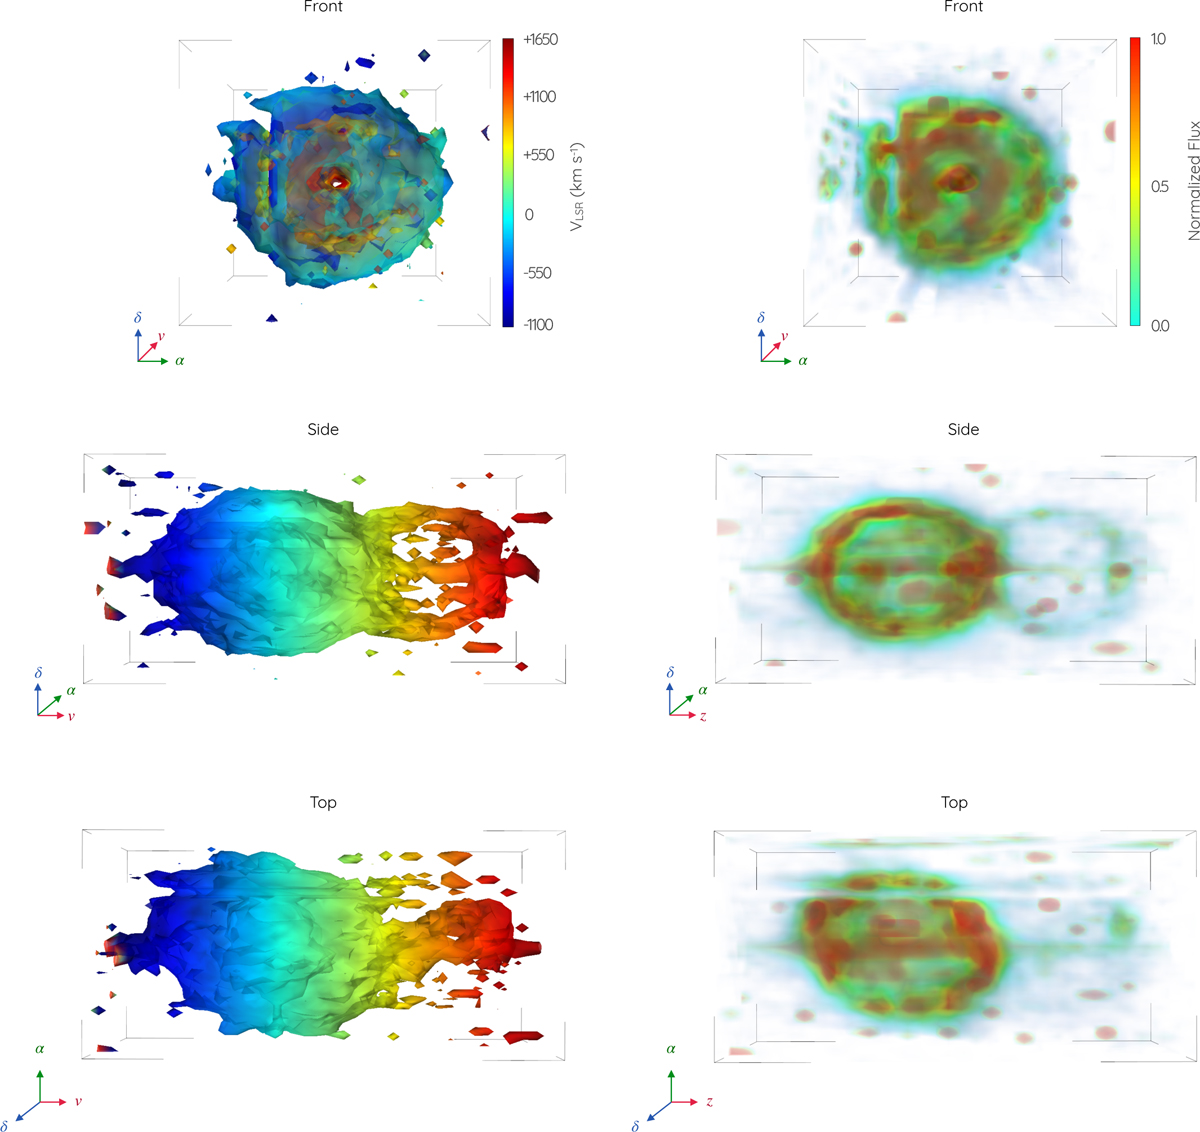
Hα+[NII] emission velocity-colored (left) and intensity (right) position–position–velocity (PPV) diagrams of FH Ser. The top row shows the projection along the observer’s point of view (i.e., the direct image), and the middle and bottom rows show the δ − λ and α − λ projections from the plane of the sky along the east-west and north-south directions, respectively. Information on the LSR radial velocity of Hα is provided by the rainbow color-code shown in the top left panel, with the color span covering the Hα and [N II] λ6584 emission lines of FH Ser. The color-code of the right panels corresponds to normalized flux.
Current usage metrics show cumulative count of Article Views (full-text article views including HTML views, PDF and ePub downloads, according to the available data) and Abstracts Views on Vision4Press platform.
Data correspond to usage on the plateform after 2015. The current usage metrics is available 48-96 hours after online publication and is updated daily on week days.
Initial download of the metrics may take a while.