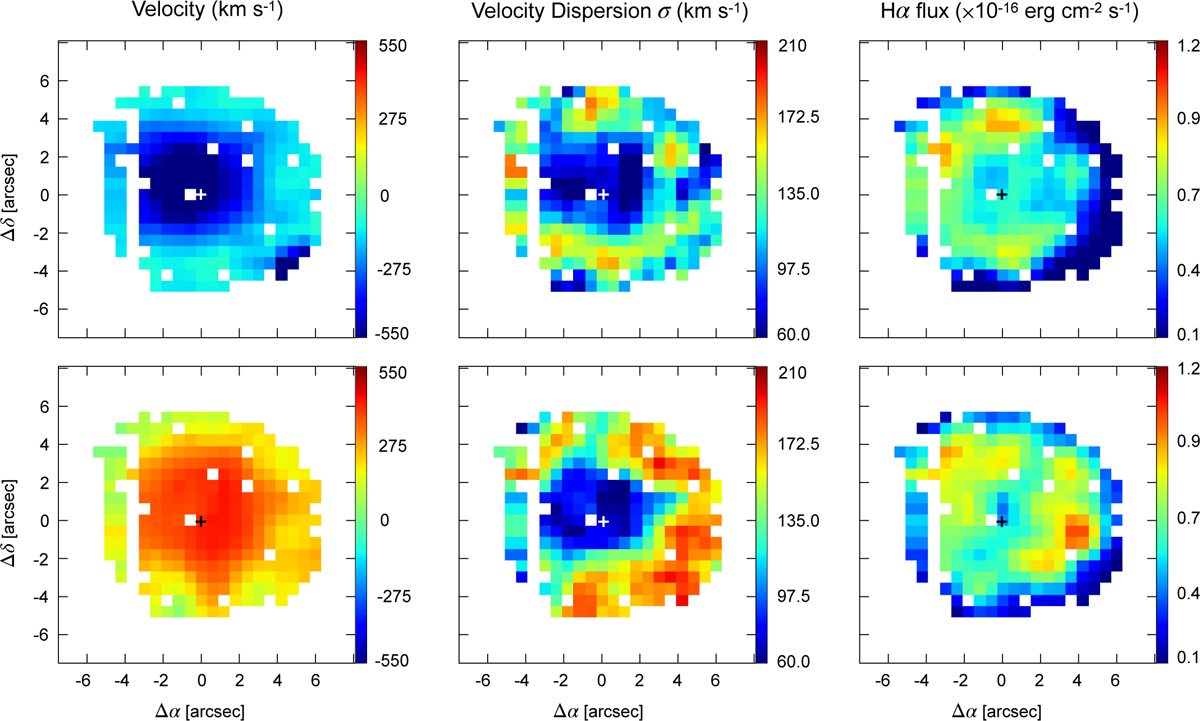
Fig. 5
Download original image
Hα velocity (left), velocity dispersion σ (middle), and flux intensity (right) emission line maps of FH Ser obtained from the multiGaussian fit of individual spaxels in the VLT VIMOS HR orange data cube. The top and bottom panels show the blue and red nebular components, respectively. The cross sign marks the position of the central star (0,0), which is spatially unresolved in the VIMOS data. In all maps, north is up and east is to the left.
Current usage metrics show cumulative count of Article Views (full-text article views including HTML views, PDF and ePub downloads, according to the available data) and Abstracts Views on Vision4Press platform.
Data correspond to usage on the plateform after 2015. The current usage metrics is available 48-96 hours after online publication and is updated daily on week days.
Initial download of the metrics may take a while.