Fig. 4
Download original image
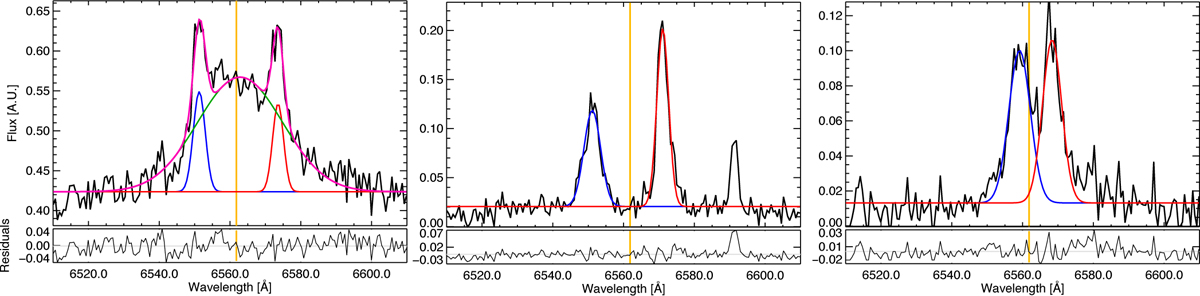
Examples of emission line spectra from the VIMOS cube (black line) and their multi-Gaussian fit (color lines) for the position of the central star (left panel), shell interior (middle panel), and shell edge (right panel). The blue and red Gaussian curves correspond to the two nebular components, and the green curve in the left panel represents a broad stellar component. The residuals from the fit are shown below each panel. As a reference, the vertical solid yellow line in all panels marks the systemic wavelength of Hα.
Current usage metrics show cumulative count of Article Views (full-text article views including HTML views, PDF and ePub downloads, according to the available data) and Abstracts Views on Vision4Press platform.
Data correspond to usage on the plateform after 2015. The current usage metrics is available 48-96 hours after online publication and is updated daily on week days.
Initial download of the metrics may take a while.