Fig. B.4
Download original image
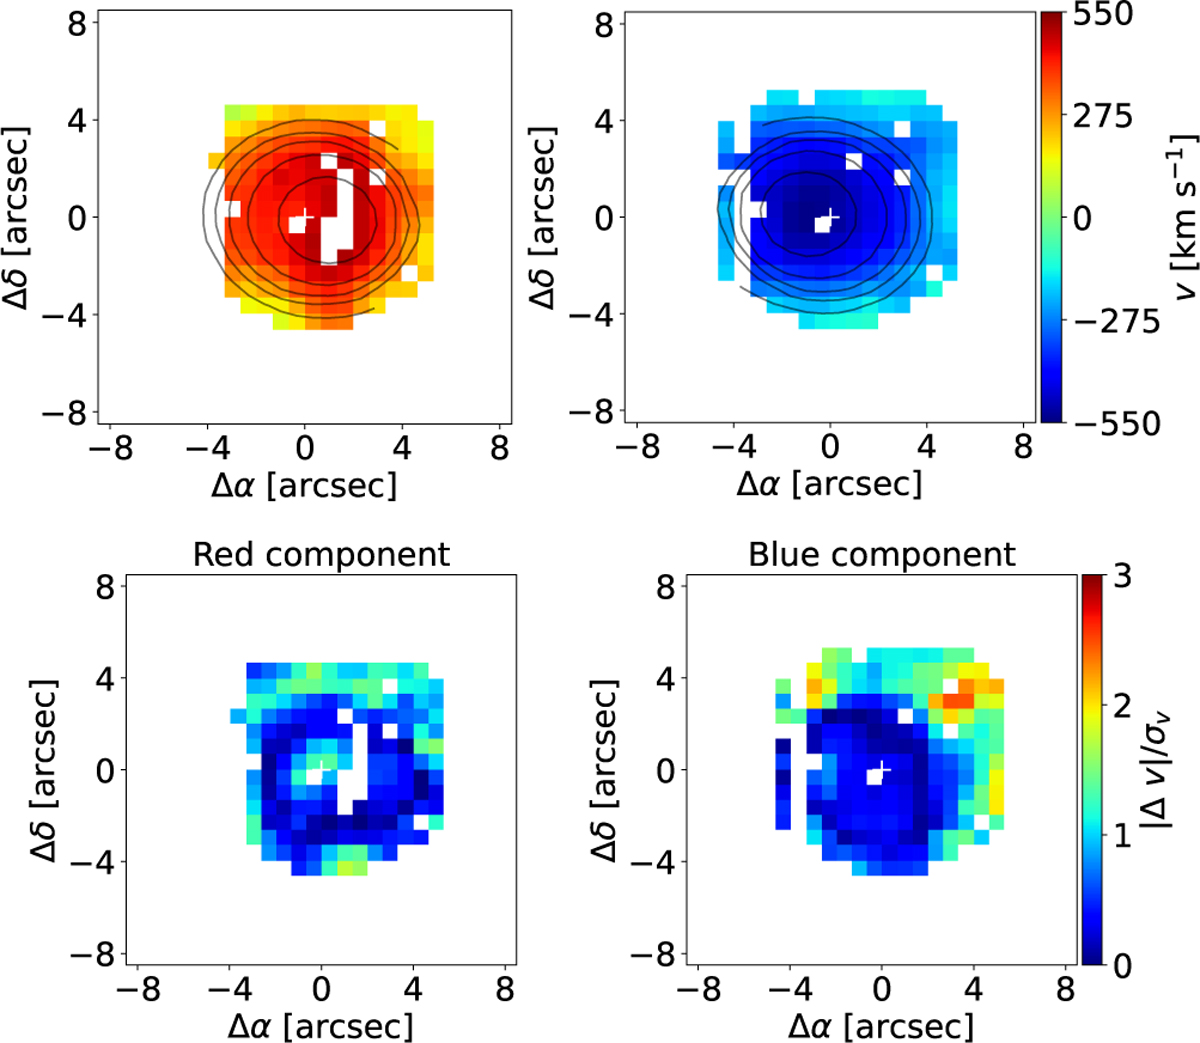
(top) MCMC best-fit model for the red (left) and blue (right) velocity components of the expanding ellipsoid shown as contours overimposed on the observed velocity maps shown in Fig. 5, and (bottom) absolute differences between the MCMC best-fit model and the velocity maps in Fig. 5 with respect to each image pixel velocity dispersion. The center is located at position (0,0) as marked with a white cross.
Current usage metrics show cumulative count of Article Views (full-text article views including HTML views, PDF and ePub downloads, according to the available data) and Abstracts Views on Vision4Press platform.
Data correspond to usage on the plateform after 2015. The current usage metrics is available 48-96 hours after online publication and is updated daily on week days.
Initial download of the metrics may take a while.