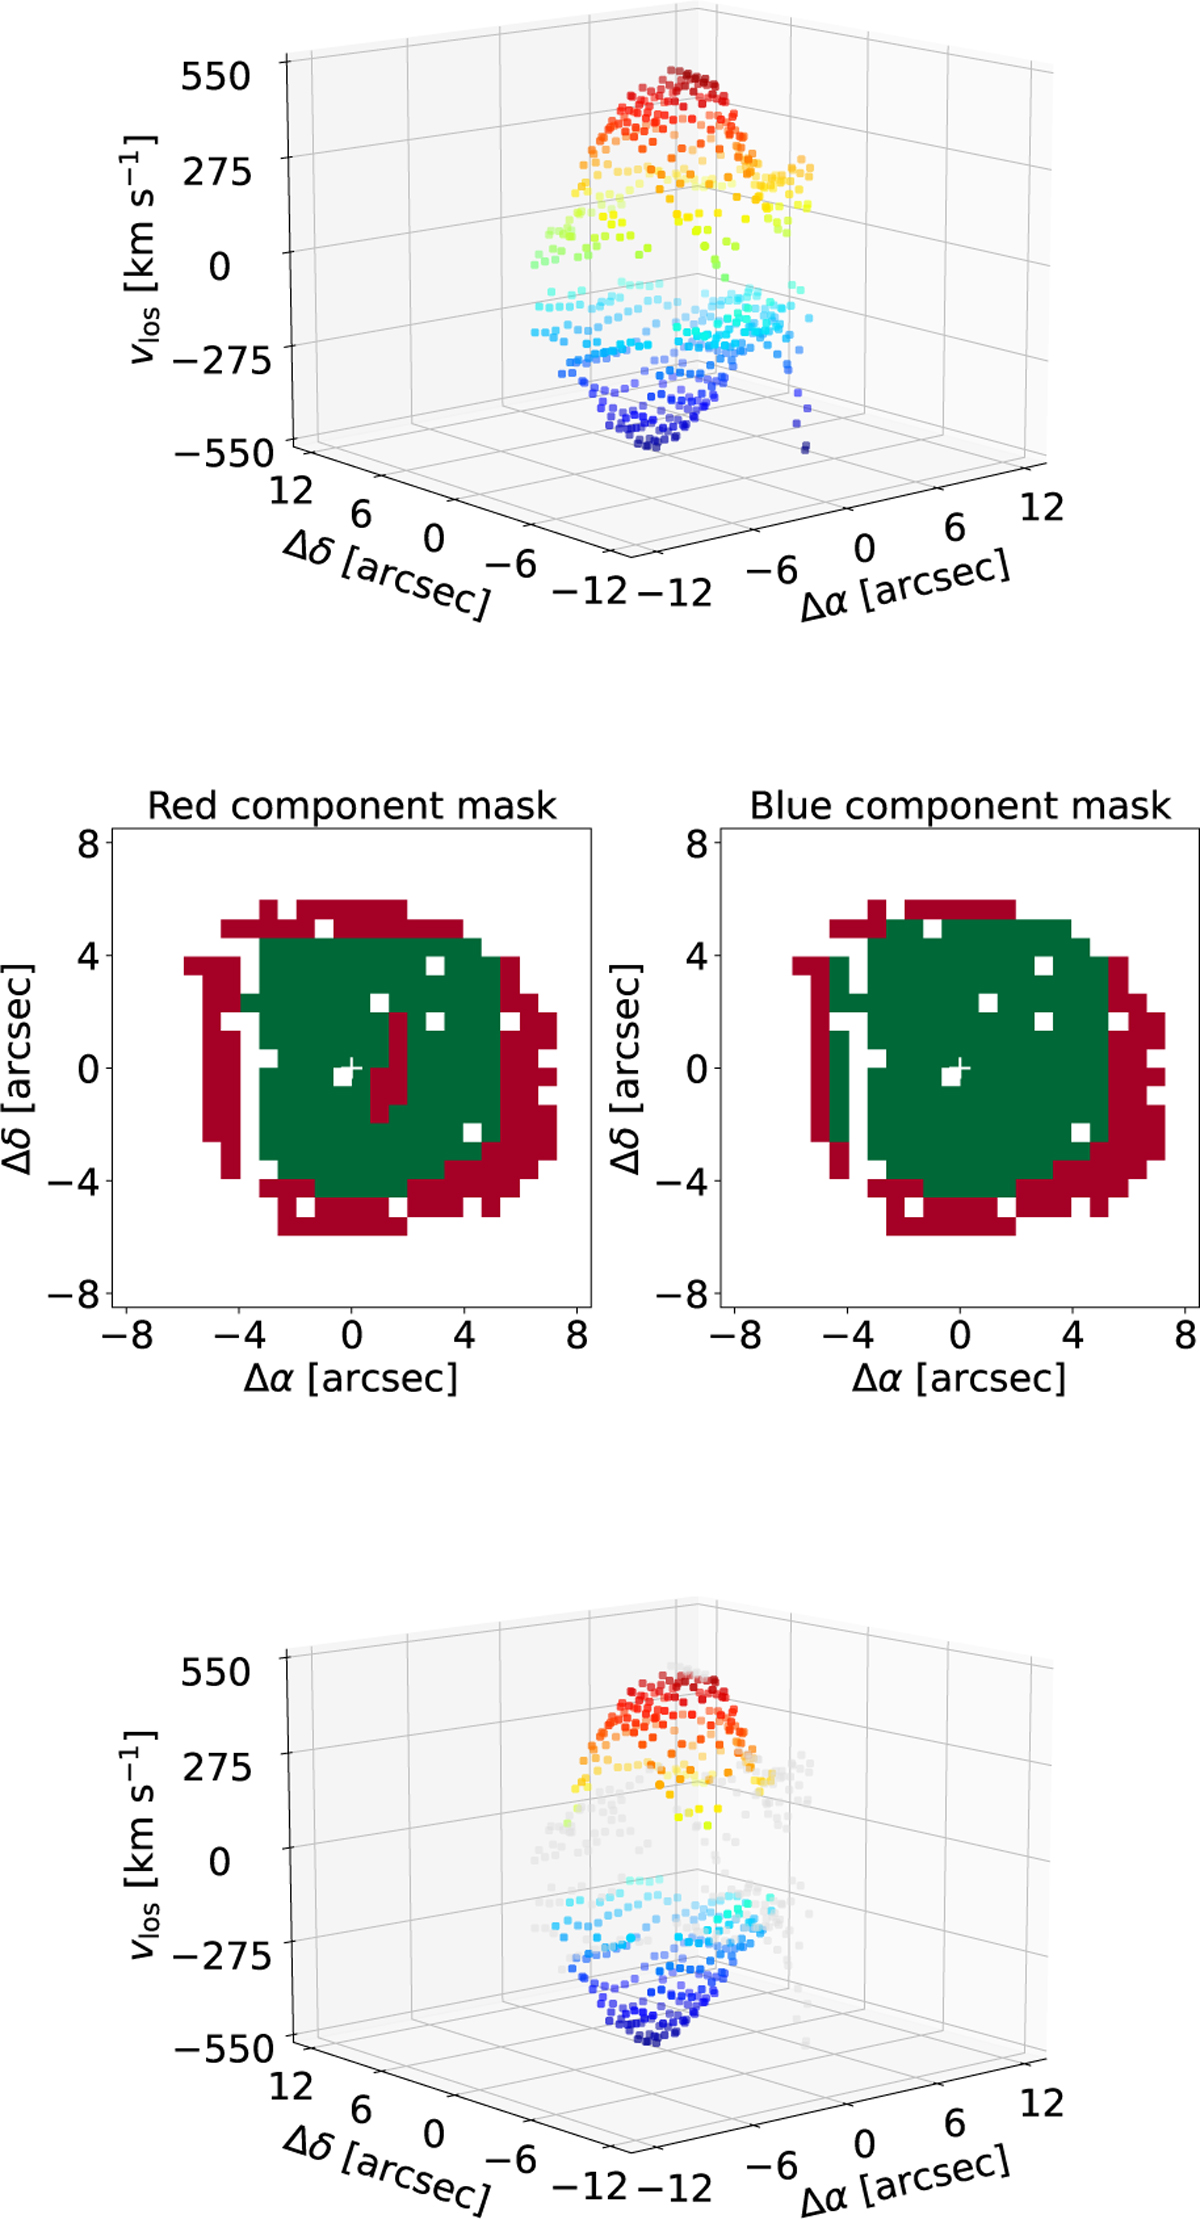
Fig. B.3
Download original image
(top) 3D scatter plot of the velocity observations. The spax- els along the edge of the shell shows noticeable excursions in velocity, as well as a "swimming ring-like" feature. (middle) Pixels used in the MCMC procedure (green) and those masked out (red) because the derived value of Vlos differs notably for an expanding spheroidal shell. The center used is located at position (0,0) as marked with a white cross. (bottom) 3D scatter plot of the velocity observations once the mask is applied (grey dots). The remaining data points resemble a spheroidal- like structure.
Current usage metrics show cumulative count of Article Views (full-text article views including HTML views, PDF and ePub downloads, according to the available data) and Abstracts Views on Vision4Press platform.
Data correspond to usage on the plateform after 2015. The current usage metrics is available 48-96 hours after online publication and is updated daily on week days.
Initial download of the metrics may take a while.