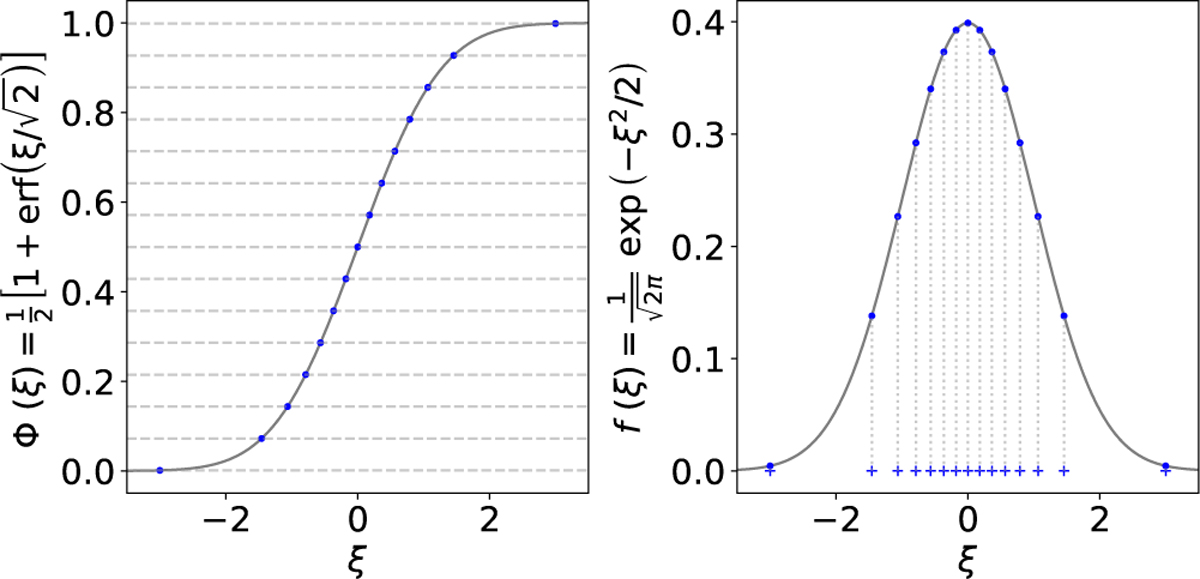
Fig. B.1
Download original image
Distribution of the width modulator ξ for 15 layers. (Left) The solid line corresponds with the normal cumulative distribution function, the dashed lines corresponds with the intervals of equal probability, meanwhile the blue dots corresponds with the intersections of the function with the intervals. (Right) The solid line corresponds with a standard normal distribution, the blue dots are the value of the function evaluated in the intersections of the equally probable intervals, meanwhile the crossed points in the bottom shows qualitatively the separation between the layers in the model with respect to the center of the shell.
Current usage metrics show cumulative count of Article Views (full-text article views including HTML views, PDF and ePub downloads, according to the available data) and Abstracts Views on Vision4Press platform.
Data correspond to usage on the plateform after 2015. The current usage metrics is available 48-96 hours after online publication and is updated daily on week days.
Initial download of the metrics may take a while.