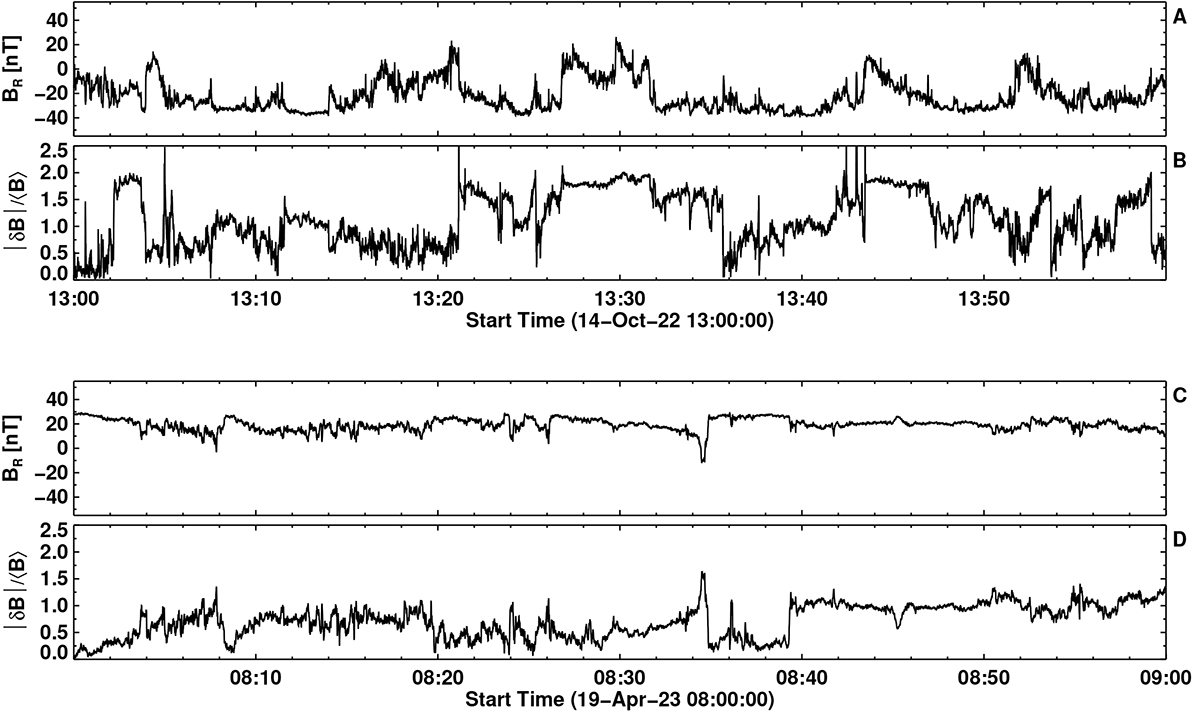
Fig. A.2.
Download original image
Magnetic field fluctuations in the solar wind. (A) Zoom into Fig. 1C, showing the time profile of the radial magnetic field in the fast wind streams over a 1 hour interval. (B) Fluctuations in the corresponding magnetic field vector normalized to its magnitude. (C) and (D) are the same as panels (A) and (B) but plotted for the case of the Alfvénic slow wind streams (Fig. 3C).
Current usage metrics show cumulative count of Article Views (full-text article views including HTML views, PDF and ePub downloads, according to the available data) and Abstracts Views on Vision4Press platform.
Data correspond to usage on the plateform after 2015. The current usage metrics is available 48-96 hours after online publication and is updated daily on week days.
Initial download of the metrics may take a while.