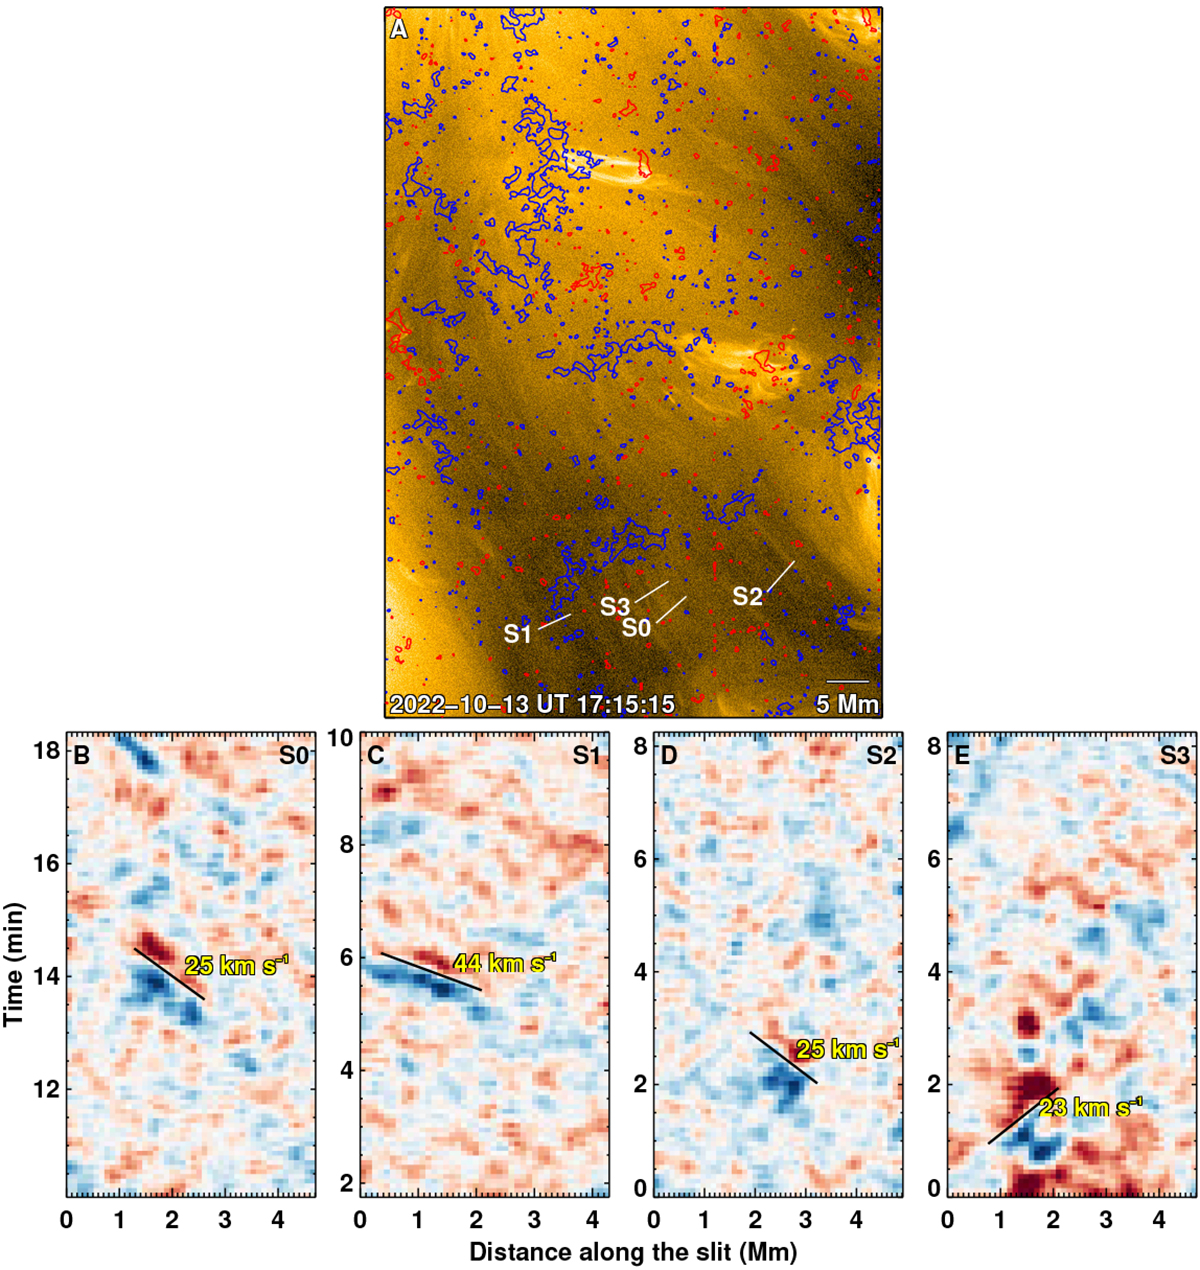
Fig. 6.
Download original image
Alfvénic pulses launched by picoflare jets. (A) Background image and contours are the same as in Fig. 2A. Lines S0–S3 are slits placed perpendicular to the length of the jet. Panels B–E are running-difference space-time maps along the corresponding slits from panel A. The red-to-blue color transition represents the intensity propagation perpendicular to the picoflare jet axis. The slanted black lines are overlaid on these propagating features to guide the eye. Their slopes in units of speed (km s−1) are also quoted. Zero along the spatial axis represents the left edge of the slit, while the origin of the time axis is with respect to the start time of the observations. An animated version of the Alfvénic pulse in panel B is shown in Movie S3.
Current usage metrics show cumulative count of Article Views (full-text article views including HTML views, PDF and ePub downloads, according to the available data) and Abstracts Views on Vision4Press platform.
Data correspond to usage on the plateform after 2015. The current usage metrics is available 48-96 hours after online publication and is updated daily on week days.
Initial download of the metrics may take a while.