Fig. 2.
Download original image
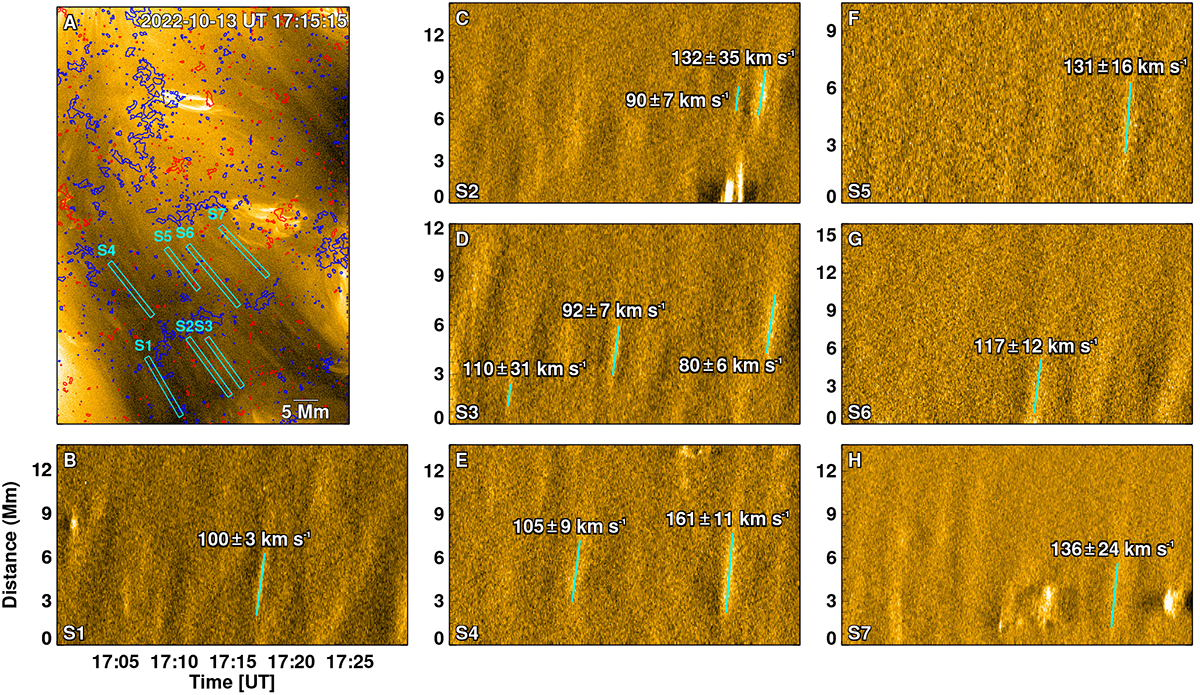
Picoflare jets at the base of fast wind. (A) Processed HRIEUV image of the coronal hole (FOV marked in Figs. 1E–F and A.4A). The contours outline photospheric magnetic field patches detected by SO/PHI-HRT (red: positive; blue: negative). An animated version of this panel is shown in Movie S1. Slanted rectangles S1–S7 are slits used to derive the corresponding time-distance maps shown in panels B–H. In these maps (panels B–H), some of the jets are identified by slanted lines, the slopes of which denote the jet speeds as quoted. See Sect. 3 for details.
Current usage metrics show cumulative count of Article Views (full-text article views including HTML views, PDF and ePub downloads, according to the available data) and Abstracts Views on Vision4Press platform.
Data correspond to usage on the plateform after 2015. The current usage metrics is available 48-96 hours after online publication and is updated daily on week days.
Initial download of the metrics may take a while.