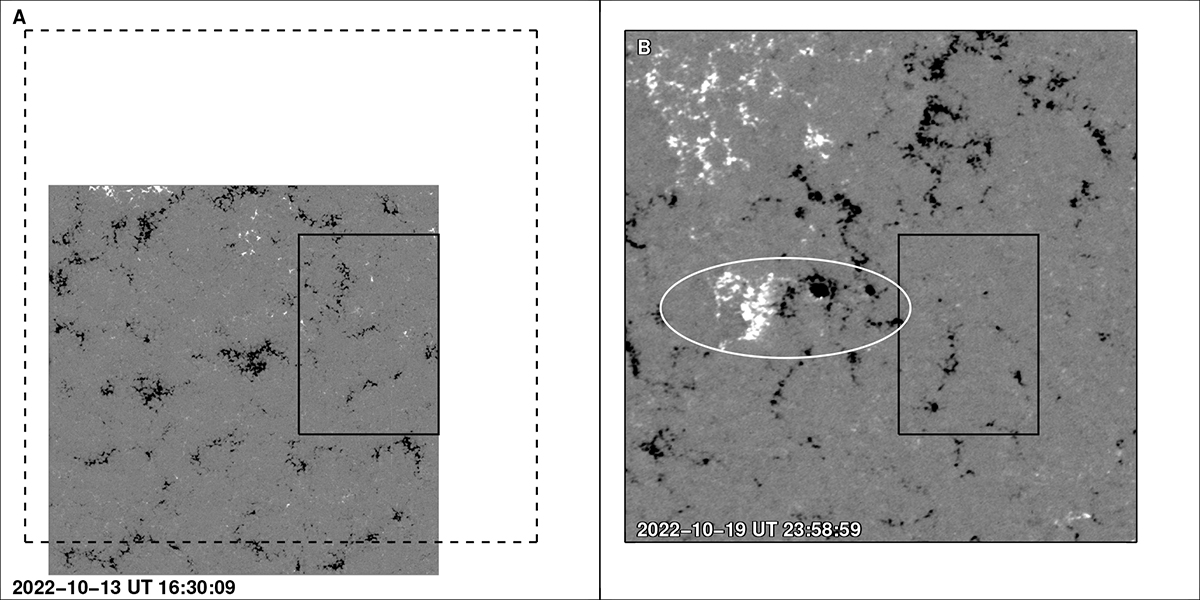
Fig. A.5.
Download original image
Surface magnetic field distribution. (A) SO/PHI-HRT magnetogram recorded 30 minutes prior to the start of the HRIEUV observations on 2022 October 13. The FOV is dominated by the negative polarity magnetic field of the coronal hole. The dashed rectangle outlines the full FOV of the HRIEUV images. The solid rectangle covers the coronal hole region that we analyzed. (B) The SDO/HMI magnetogram covering the same Carrington coordinates as the full FOV of HRIEUV images (i.e., the dashed rectangle in panel A), but some 6 days later. The solid rectangle covers the position of the coronal hole section that we analyzed on the HMI map. In both maps the magnetic field strength is saturated at ±200 G. The white ellipse in panel B encloses a newly emerged magnetic bipole in the FOV after the 2022 October 13 Solar Orbiter campaign. This bipole can also be seen in the synoptic radial magnetic field map (adjacent to the solid white rectangle in Fig. 1E), which caused the appearance of brighter loop-like emission patterns near the northern section of the coronal hole as seen in the synoptic coronal map (Fig. 1F).
Current usage metrics show cumulative count of Article Views (full-text article views including HTML views, PDF and ePub downloads, according to the available data) and Abstracts Views on Vision4Press platform.
Data correspond to usage on the plateform after 2015. The current usage metrics is available 48-96 hours after online publication and is updated daily on week days.
Initial download of the metrics may take a while.