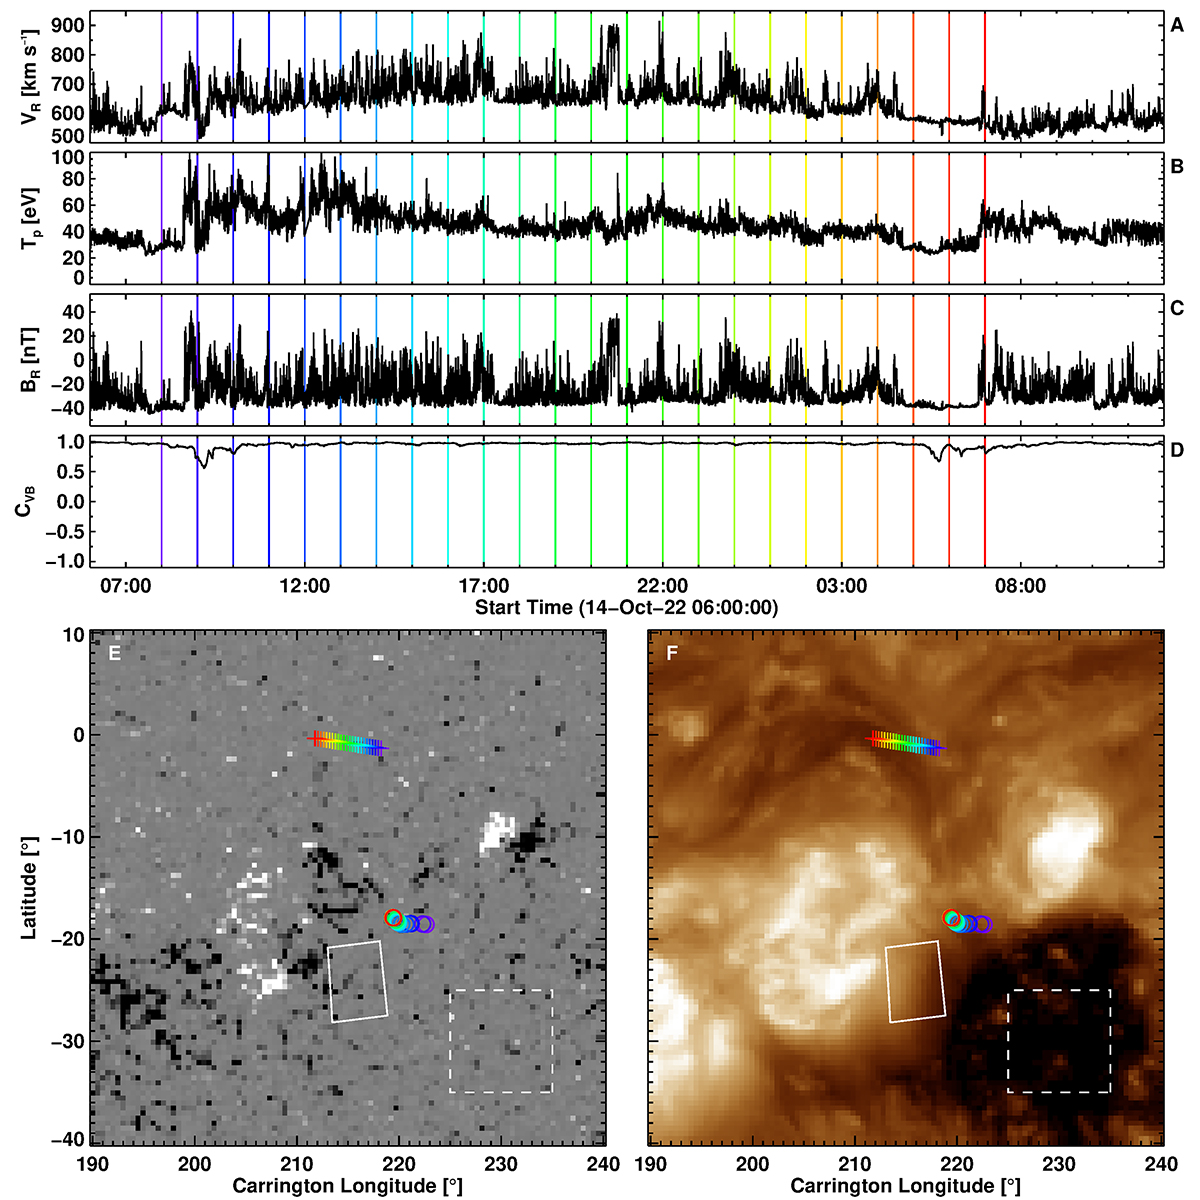
Fig. 1.
Download original image
Footpoint regions of fast solar wind streams. (A)–(C) Time series of in situ measurements of solar wind radial velocity (VR), proton temperature (Tp), and the radial component of the magnetic field in the solar wind (BR). (D) Alfvénicity of the solar wind (CVB). The vertical colored lines mark the time-stamps at 1-hour cadence over the course of a 24-hour period. Partial FOV from the Carrington synoptic map (Carrington rotation number CR2263), showing the distribution of photospheric radial magnetic field with the Helioseismic and Magnetic Imager on board the Solar Dynamics Observatory, saturated at ±100 G (E), and coronal EUV emission with a 193 Å filter on the Atmospheric Imaging Assembly of the Solar Dynamics Observatory (F). The sub-spacecraft points of Solar Orbiter on the Sun at a 1-hour cadence, starting from 2022 October 14 06:00 UT, are indicated by colored plus symbols (colors correspond to the vertical lines in panels A–D). The respective colored circles represent locations of magnetic connectivity of the spacecraft onto the solar surface, based on a PFSS model. The solid rectangle outlines the partial FOV of the HRIEUV instrument shown in Figs. 2A and A.4A. The dashed square region is used to calculate the coronal hole expansion factor plotted in Fig. 5. See Appendices A, B, and C for details.
Current usage metrics show cumulative count of Article Views (full-text article views including HTML views, PDF and ePub downloads, according to the available data) and Abstracts Views on Vision4Press platform.
Data correspond to usage on the plateform after 2015. The current usage metrics is available 48-96 hours after online publication and is updated daily on week days.
Initial download of the metrics may take a while.