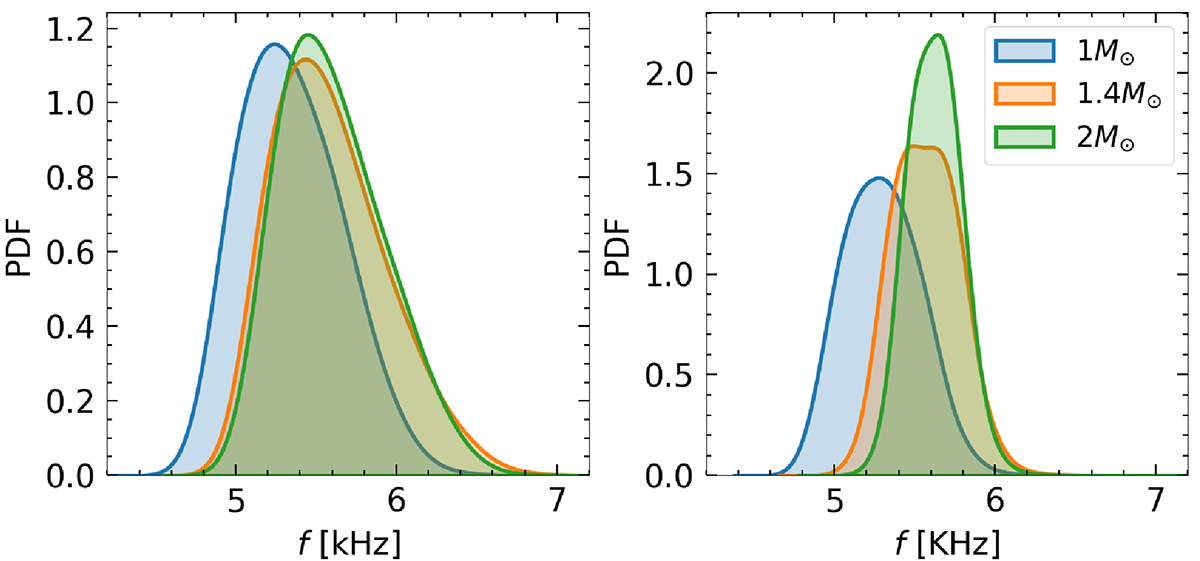
Fig. C.1.
Download original image
Posterior distribution of the frequencies at 1 M⊙, 1.4 M⊙ and 2 M⊙ for the p1-mode. The left panel refers to the prescription described in Sec. 5.3 while the right is obtained by inserting the RX(M) relation of each model in (15) with the QU coefficients ai of Sotani (2021). The frequencies in the right panel have a narrower distribution, meaning that the prescription in (17) is necessary to make the spread of our synthetic full GR frequencies similar to the one found by Sotani (2021).
Current usage metrics show cumulative count of Article Views (full-text article views including HTML views, PDF and ePub downloads, according to the available data) and Abstracts Views on Vision4Press platform.
Data correspond to usage on the plateform after 2015. The current usage metrics is available 48-96 hours after online publication and is updated daily on week days.
Initial download of the metrics may take a while.