Fig. 5.
Download original image
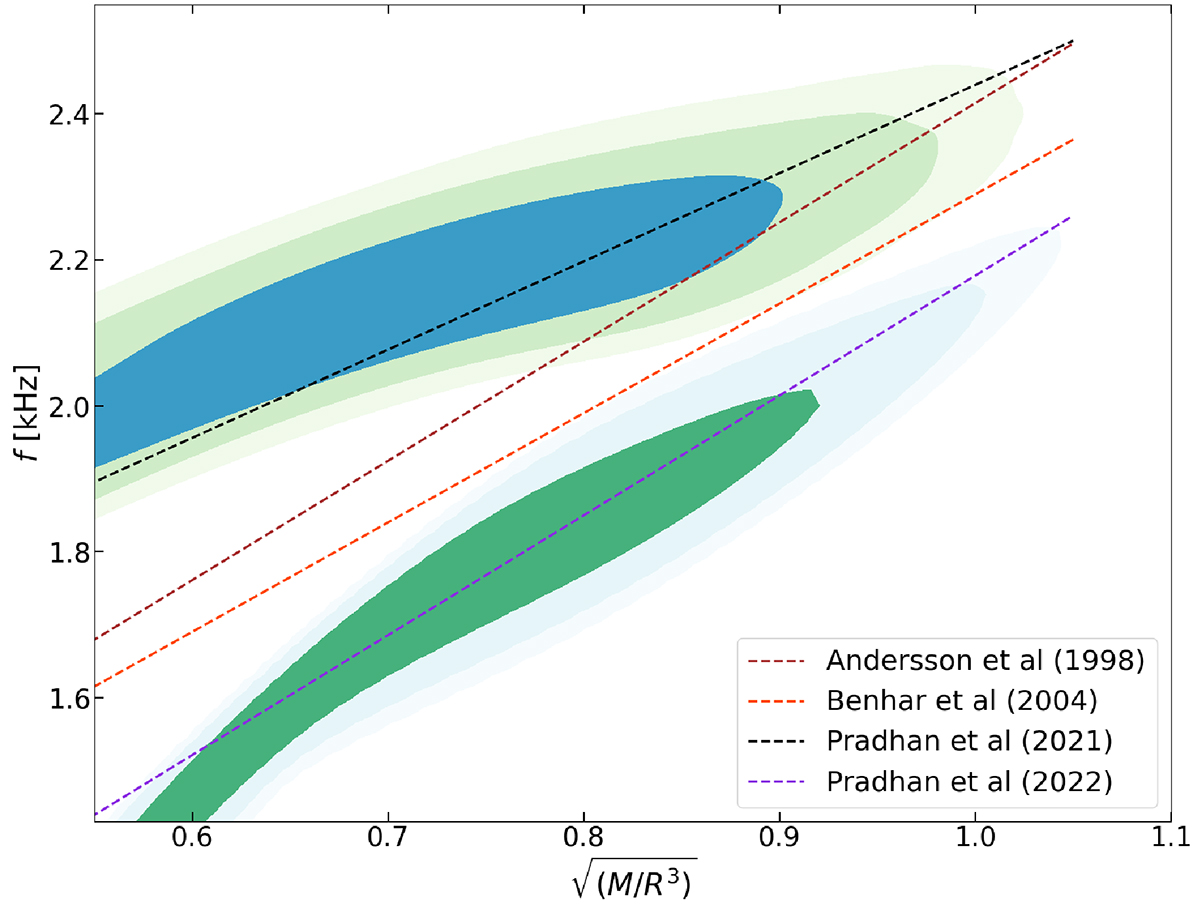
Distributions of f-mode frequencies as a function of the average density ![]() . The upper colour map refers to the frequencies we obtain within the Cowling approximation, while the lower distribution is obtained by reversing the relation in Eq. (15) with the coefficients ai from Pradhan et al. (2022). For comparison, the lines are the several fits listed in Tab-II of Pradhan et al. (2022). The three shaded regions contain the 68%, 95%, and 99% quantiles of the distribution.
. The upper colour map refers to the frequencies we obtain within the Cowling approximation, while the lower distribution is obtained by reversing the relation in Eq. (15) with the coefficients ai from Pradhan et al. (2022). For comparison, the lines are the several fits listed in Tab-II of Pradhan et al. (2022). The three shaded regions contain the 68%, 95%, and 99% quantiles of the distribution.
Current usage metrics show cumulative count of Article Views (full-text article views including HTML views, PDF and ePub downloads, according to the available data) and Abstracts Views on Vision4Press platform.
Data correspond to usage on the plateform after 2015. The current usage metrics is available 48-96 hours after online publication and is updated daily on week days.
Initial download of the metrics may take a while.