Fig. 2.
Download original image
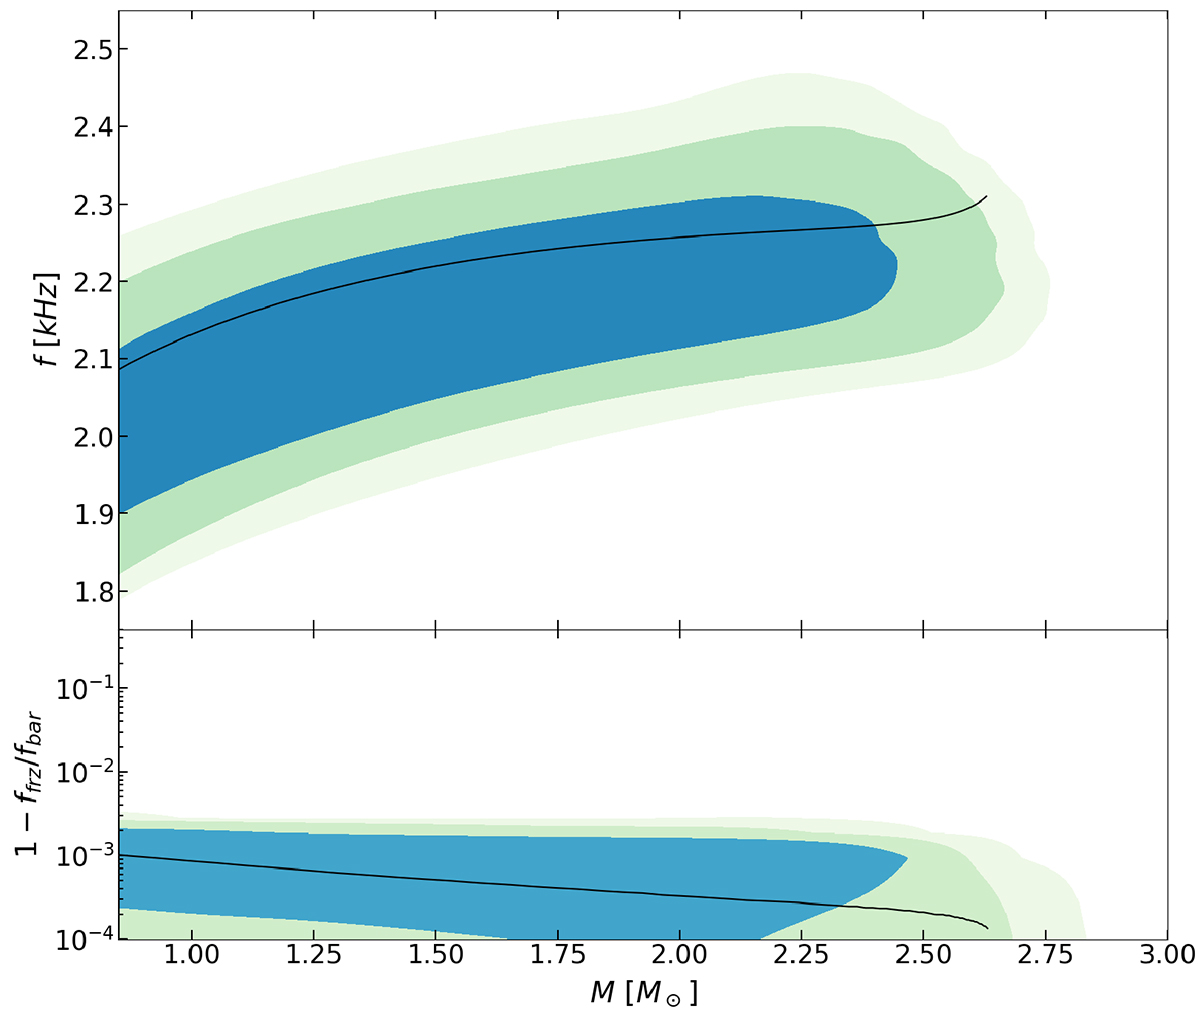
Posterior probability density for frequencies of frozen f-mode (upper panel). The lower panel shows the relative difference between the frequencies in the frozen limit and the barotropic limit. The shaded regions represent the 68%, 95%, and 99% percentiles, respectively, while the black line indicates the model with the highest likelihood.
Current usage metrics show cumulative count of Article Views (full-text article views including HTML views, PDF and ePub downloads, according to the available data) and Abstracts Views on Vision4Press platform.
Data correspond to usage on the plateform after 2015. The current usage metrics is available 48-96 hours after online publication and is updated daily on week days.
Initial download of the metrics may take a while.