Open Access
Fig. 1.
Download original image
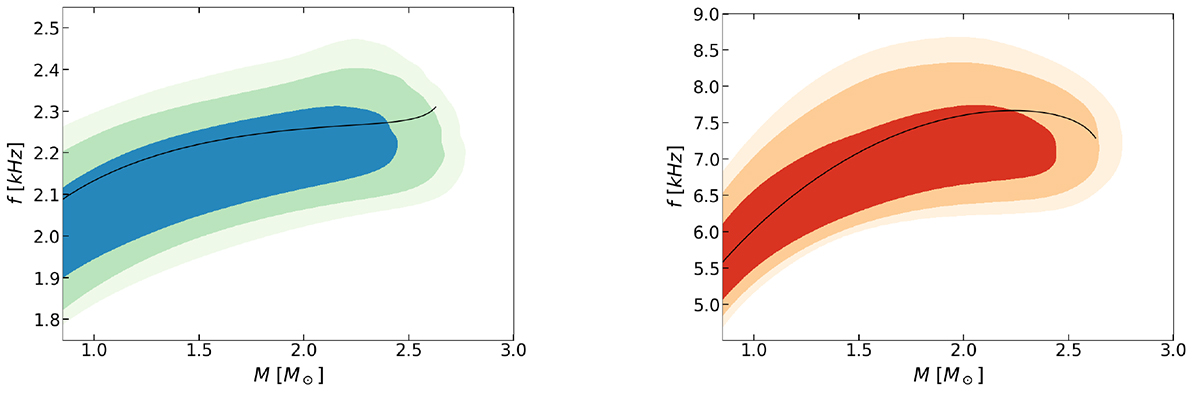
Probability density distributions for f-mode frequencies (left) and p1-mode frequencies (right), both obtained within the Cowling approximation in the barotropic limit. The three shaded regions refer to the 68%, 95%, and 99% percentiles. The solid black line represents the model with the highest likelihood.
Current usage metrics show cumulative count of Article Views (full-text article views including HTML views, PDF and ePub downloads, according to the available data) and Abstracts Views on Vision4Press platform.
Data correspond to usage on the plateform after 2015. The current usage metrics is available 48-96 hours after online publication and is updated daily on week days.
Initial download of the metrics may take a while.