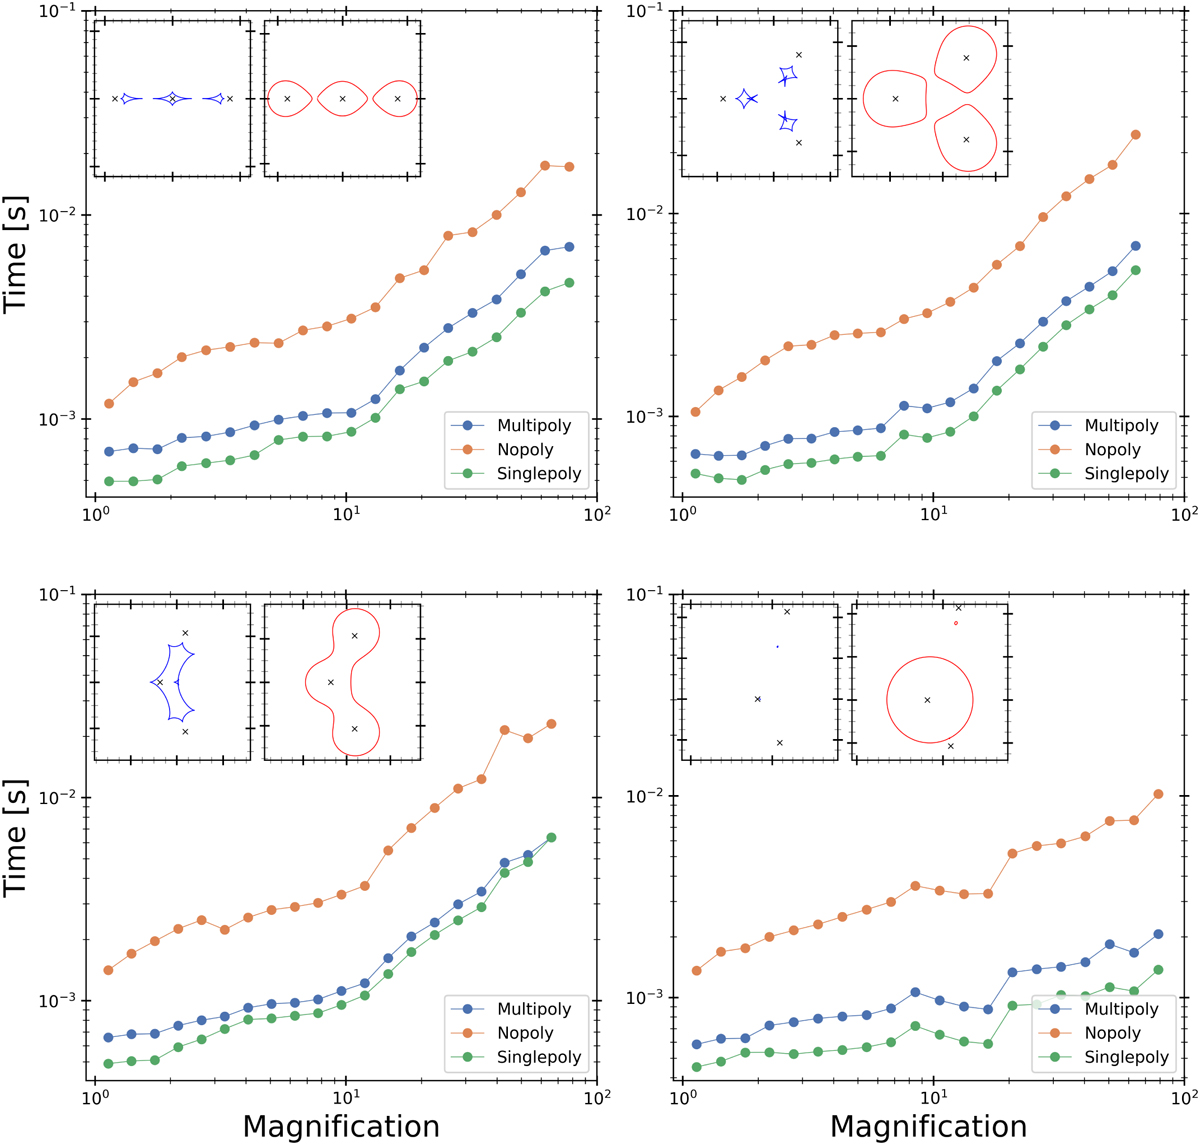
Fig. 7
Download original image
Comparisons of the performance of the Singlepoly, Multipoly, and Nopoly algorithms across different levels of magnification in a three-lens system. The points reflect the averaged computational performance across various source positions within the same magnification bin. Four different lens configurations were selected, characterized by the parameters (q2,q3,s2,s3,θ,ρ). Here q2 and q3 represent the mass ratios relative to the highest mass, s2 and s3 denote the distances of these masses from the highest mass, θ is the angle between the lines connecting the two lower masses to the highest mass, and ρ is the source radius.The configurations are A [1,1,1.7,1.7, π, 10−3], B [1,1,1.5,1.5, π/3,10−3],C [1, 1,1.2,1.2,0.7π, 10−3], D [3.3 * 10−6, 10−3, 1,2,0.7π, 10−3ļ. The images in the top left of each graph show the caustics and critical curves for each lens configuration. The computational performance of the three algorithms in a three-lens configuration remains consistent across different lens configurations. The order of efficiency, with Singlepoly being the fastest and Nopoly the slowest, is maintained regardless of the specific lens parameters.
Current usage metrics show cumulative count of Article Views (full-text article views including HTML views, PDF and ePub downloads, according to the available data) and Abstracts Views on Vision4Press platform.
Data correspond to usage on the plateform after 2015. The current usage metrics is available 48-96 hours after online publication and is updated daily on week days.
Initial download of the metrics may take a while.