Fig. 4
Download original image
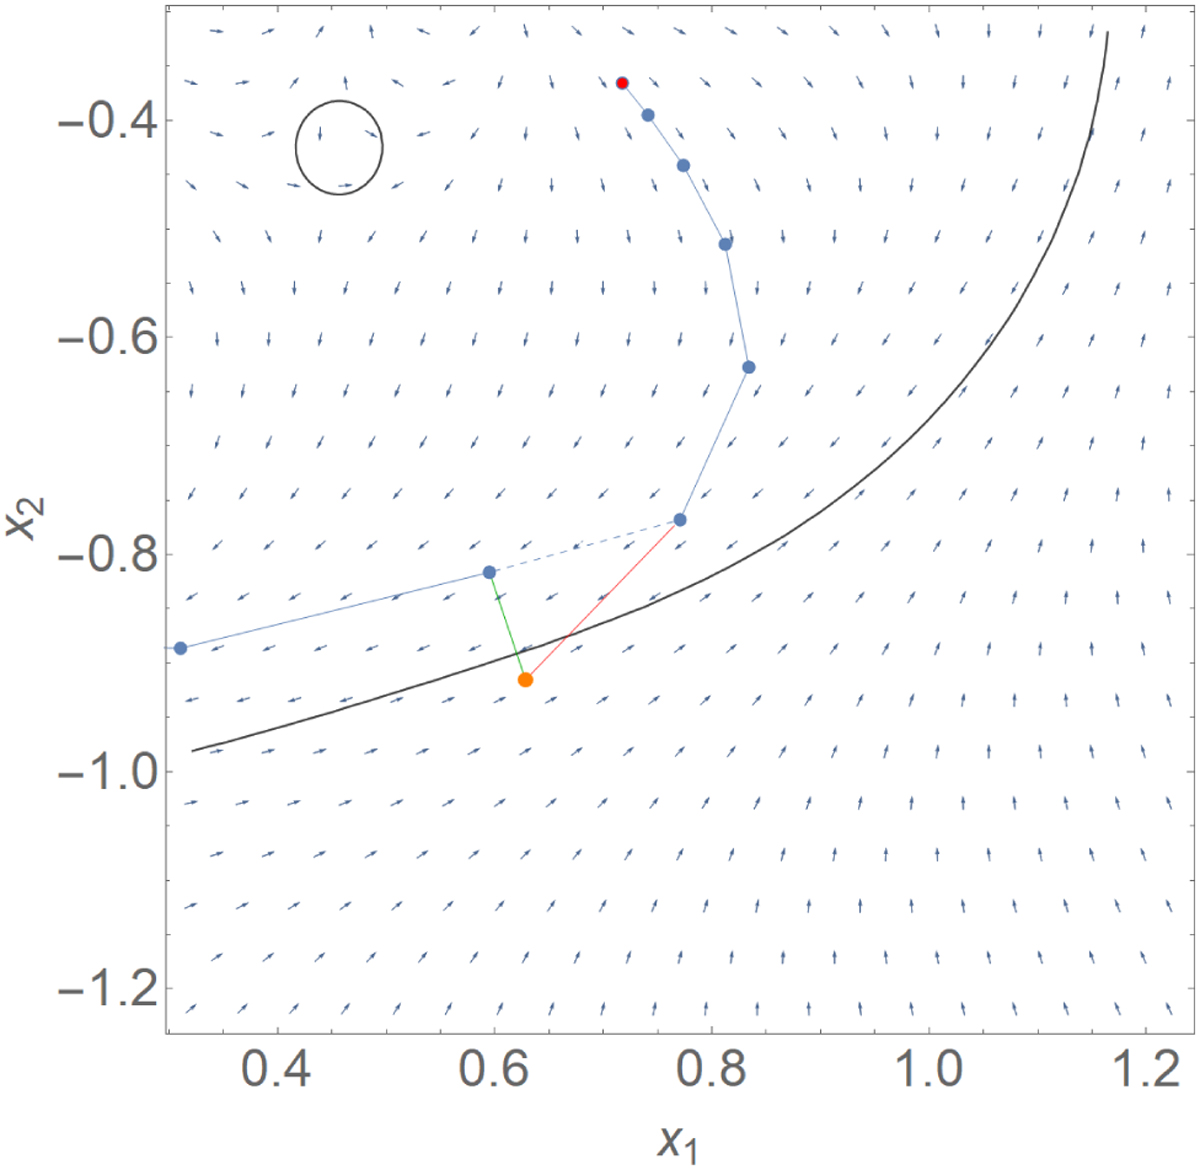
In this chain starting from the red initial seed, after five steps, the ϵ from Eq. (18), represented here by the red step, would cross the critical curve (the gray line). At this point, the δ-correction (28), represented by the green step, pushes the chain back to the same Jacobian region, ensuring that the exploration continues without missing any solutions.
Current usage metrics show cumulative count of Article Views (full-text article views including HTML views, PDF and ePub downloads, according to the available data) and Abstracts Views on Vision4Press platform.
Data correspond to usage on the plateform after 2015. The current usage metrics is available 48-96 hours after online publication and is updated daily on week days.
Initial download of the metrics may take a while.