Fig. 3
Download original image
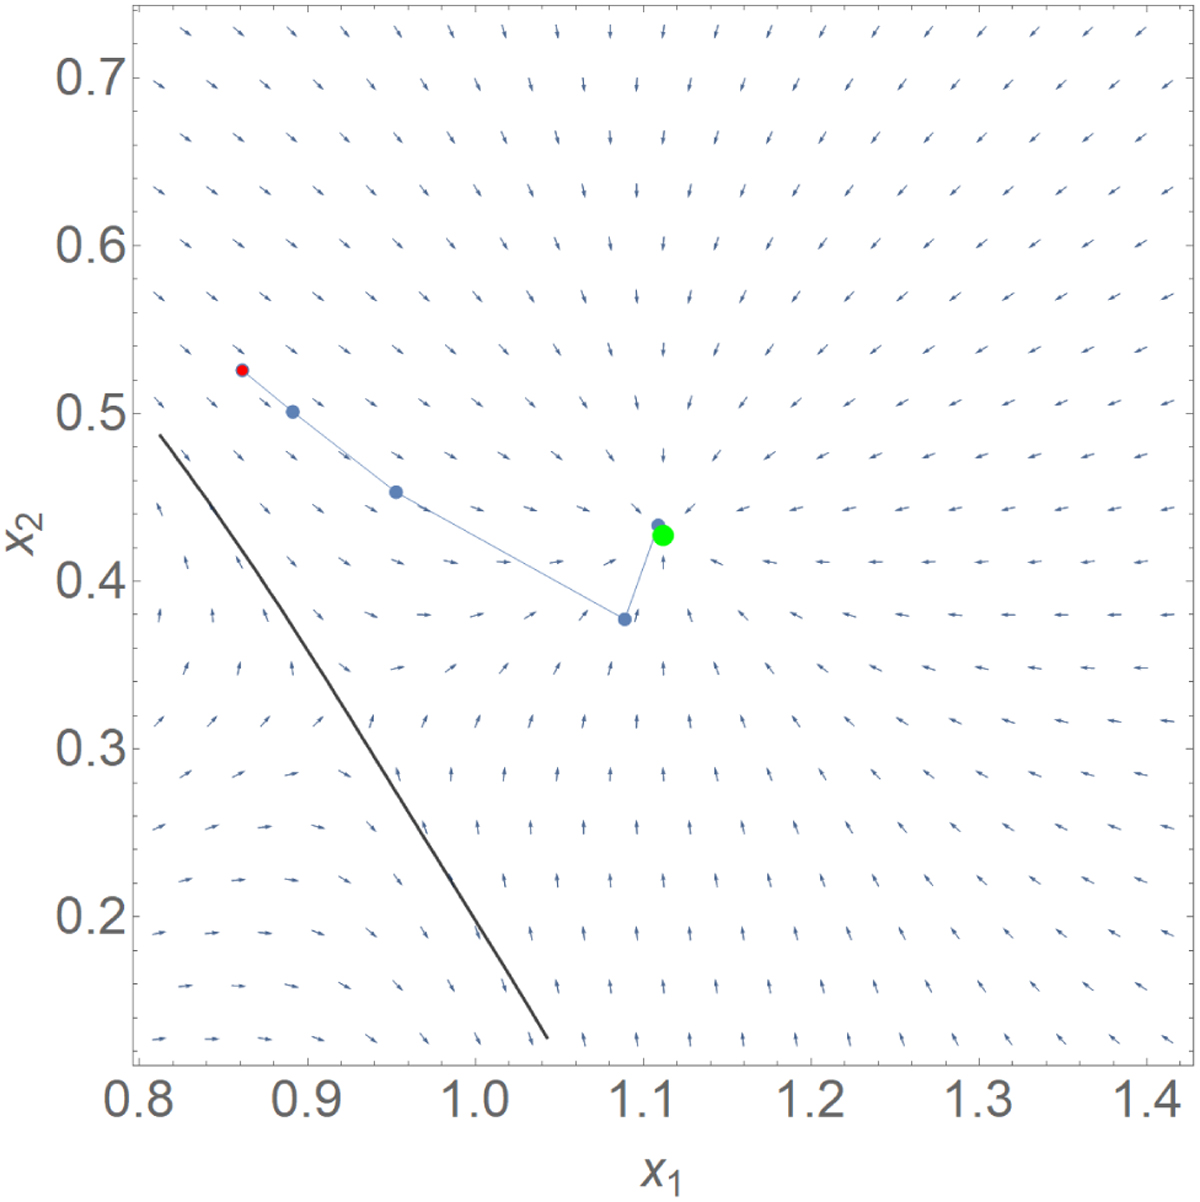
Illustration of the Newton–Raphson method starting from an initial seed (red dot) and reaching a solution of the lens equation (green dot) in five steps. The vector field indicates the direction of ϵ as calculated by Eq. (18). First, we note that the field locally converges to the solution. However, beyond a nearby critical curve (gray line in the bottom left) the vector flow diverges from this solution. This is a good reason to forbid critical curve crossing (Sect. 6.2.3).
Current usage metrics show cumulative count of Article Views (full-text article views including HTML views, PDF and ePub downloads, according to the available data) and Abstracts Views on Vision4Press platform.
Data correspond to usage on the plateform after 2015. The current usage metrics is available 48-96 hours after online publication and is updated daily on week days.
Initial download of the metrics may take a while.