Fig. 1
Download original image
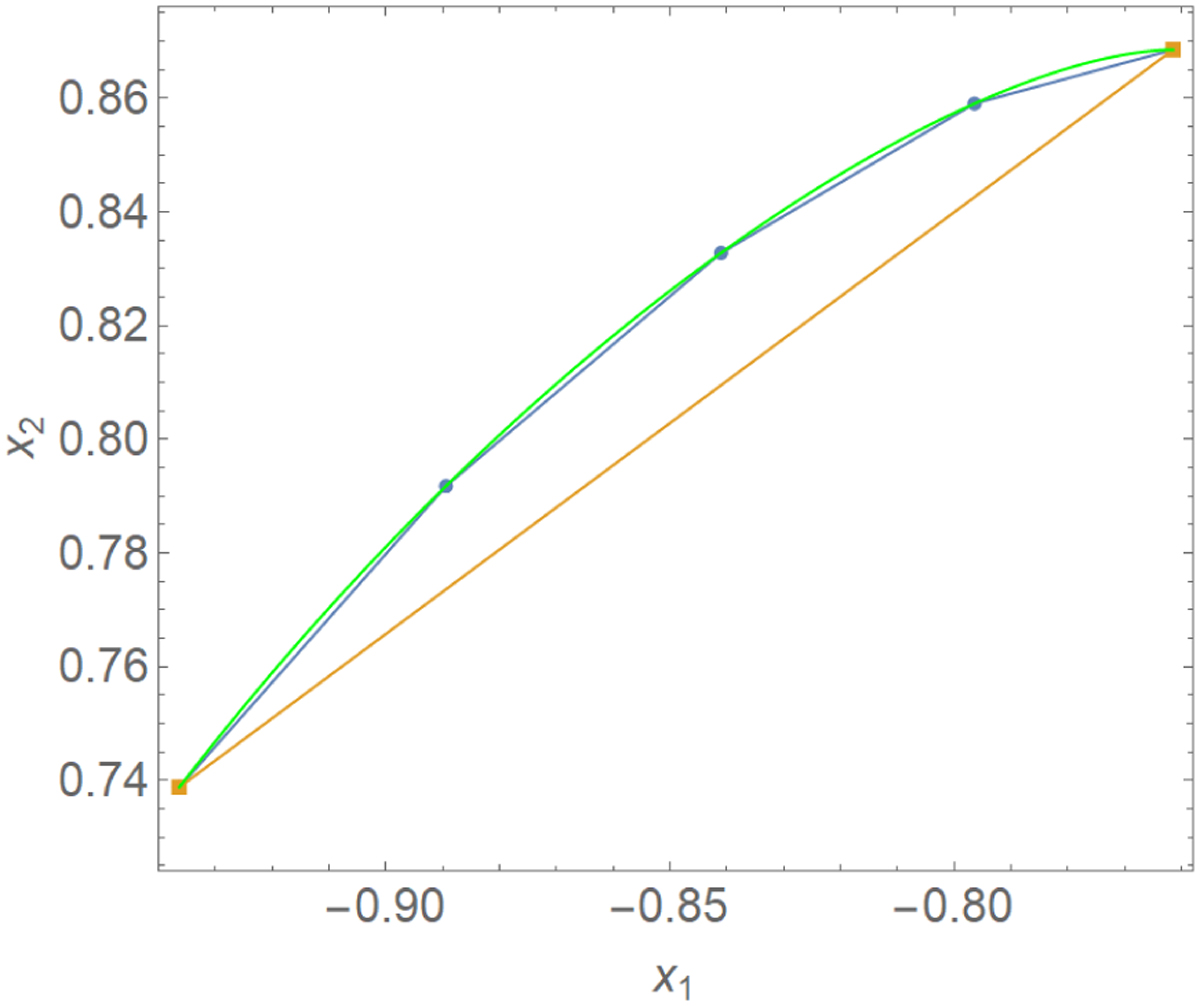
Schematic illustration of the power of parabolic correction. Here we have an arc of an image in green. The straight line in orange would provide a poor approximation to the integral of the arc if we were limited to the trapezium approximation AT. Adding the parabolic correction AP calculated at the two extrema of the arc, we improve the accuracy in the integral to the level that would be achieved by the trapezium approximation only with a four times denser sampling of the image contour, corresponding to the blue spline. Therefore, thanks to the parabolic correction, we can stop the sampling earlier (in this case the two extrema of this arc suffice) and achieve accurate estimates with fewer points and consequently shorter computational time.
Current usage metrics show cumulative count of Article Views (full-text article views including HTML views, PDF and ePub downloads, according to the available data) and Abstracts Views on Vision4Press platform.
Data correspond to usage on the plateform after 2015. The current usage metrics is available 48-96 hours after online publication and is updated daily on week days.
Initial download of the metrics may take a while.