Fig. 7
Download original image
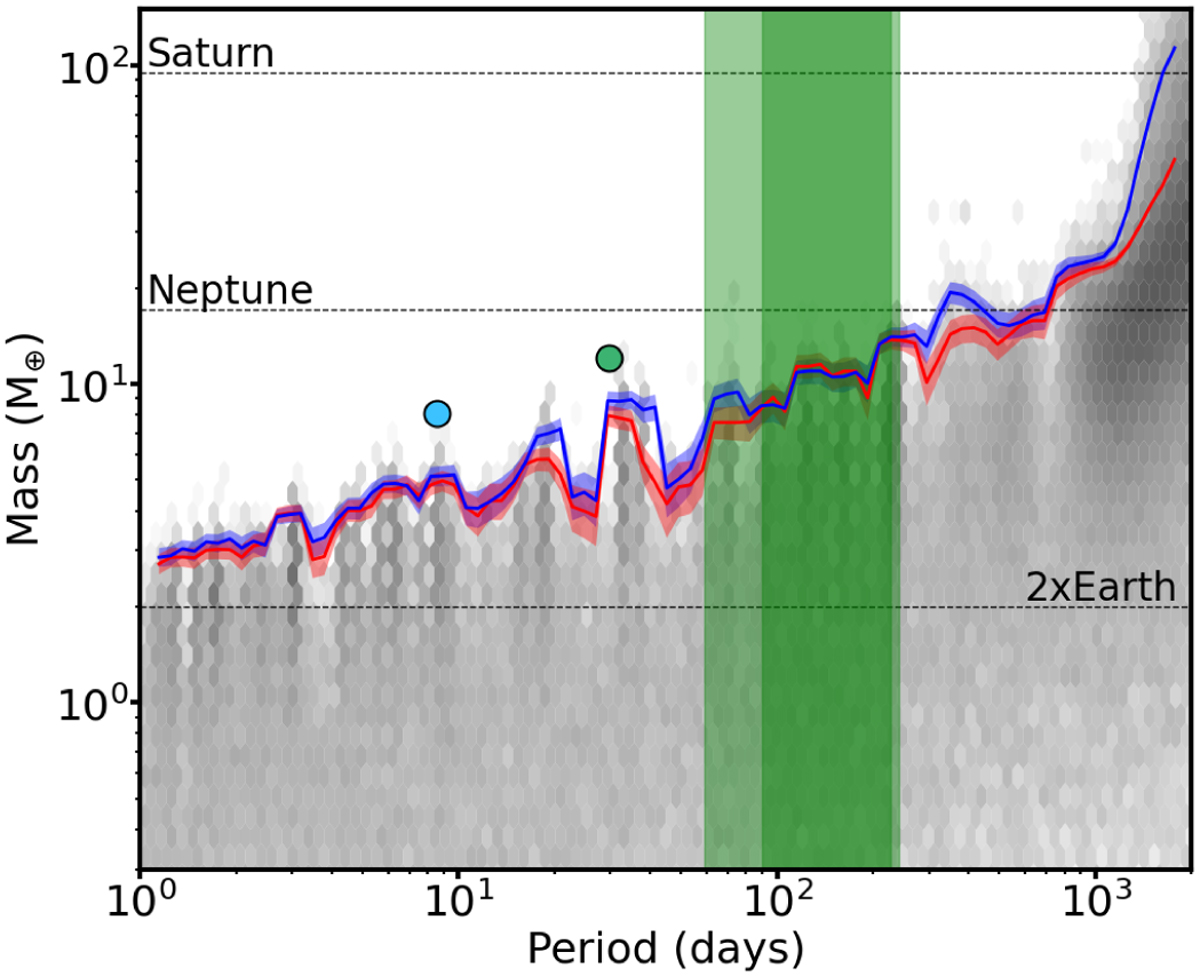
Hexbin plot showing the posterior samples obtained from kima runs on the KOBE-1 RV data with Np fixed to 1. The blue line shows the 99% detection limit line, whereas the red line shows the same line computed on a subset of posterior samples with eccentricity <0.1. The uncertainties on these lines are illustrated by the faded lines of the associated color. The blue and green points represent KOBE-1 b and c, respectively. The extents of the optimistic and conservative HZ for the KOBE-1 system are denoted by the light and dark green shaded regions.
Current usage metrics show cumulative count of Article Views (full-text article views including HTML views, PDF and ePub downloads, according to the available data) and Abstracts Views on Vision4Press platform.
Data correspond to usage on the plateform after 2015. The current usage metrics is available 48-96 hours after online publication and is updated daily on week days.
Initial download of the metrics may take a while.