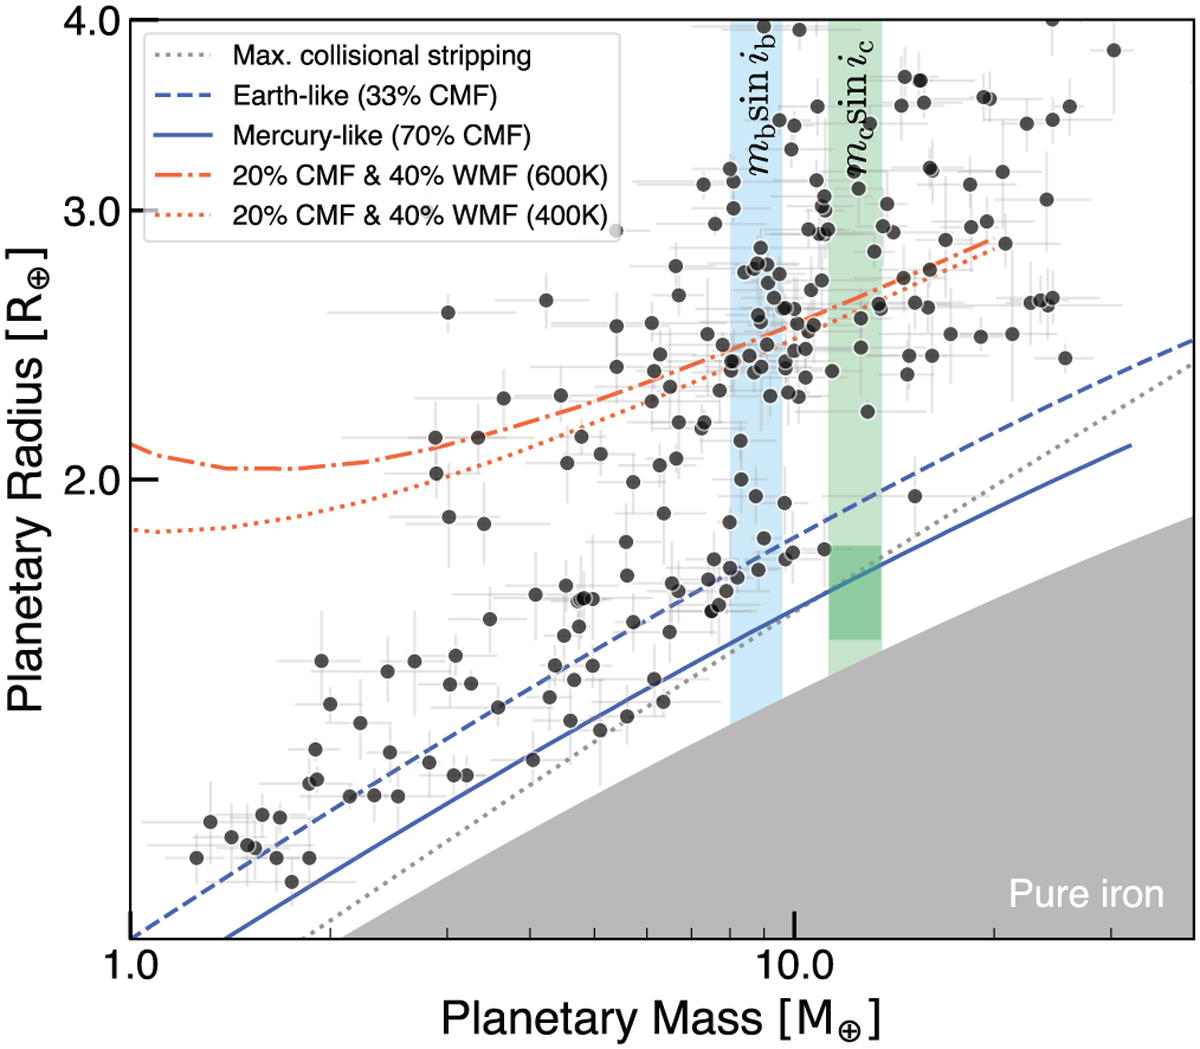
Fig. 6
Download original image
Planetary mass-radius diagram. Vertical regions indicate the minimum mass within 1σ of the planets detected around KOBE-1 (blue for planet b, and green for c). Darker green region shows the 1σ location for KOBE-1 c if we assume it causes the single-TESS transit (solely for illustrative purposes; see more in Sect. 4.2 and Appendix C). Different radius-mass models are shown as identified in the legend to guide the reader on the separated populations (blue lines trace tracks for superEarths and orange lines for sub-Neptunes; Zeng et al. 2019; Aguichine et al. 2021). CMF and WMF refer to the core and water mass fractions, respectively.
Current usage metrics show cumulative count of Article Views (full-text article views including HTML views, PDF and ePub downloads, according to the available data) and Abstracts Views on Vision4Press platform.
Data correspond to usage on the plateform after 2015. The current usage metrics is available 48-96 hours after online publication and is updated daily on week days.
Initial download of the metrics may take a while.