Fig. 2
Download original image
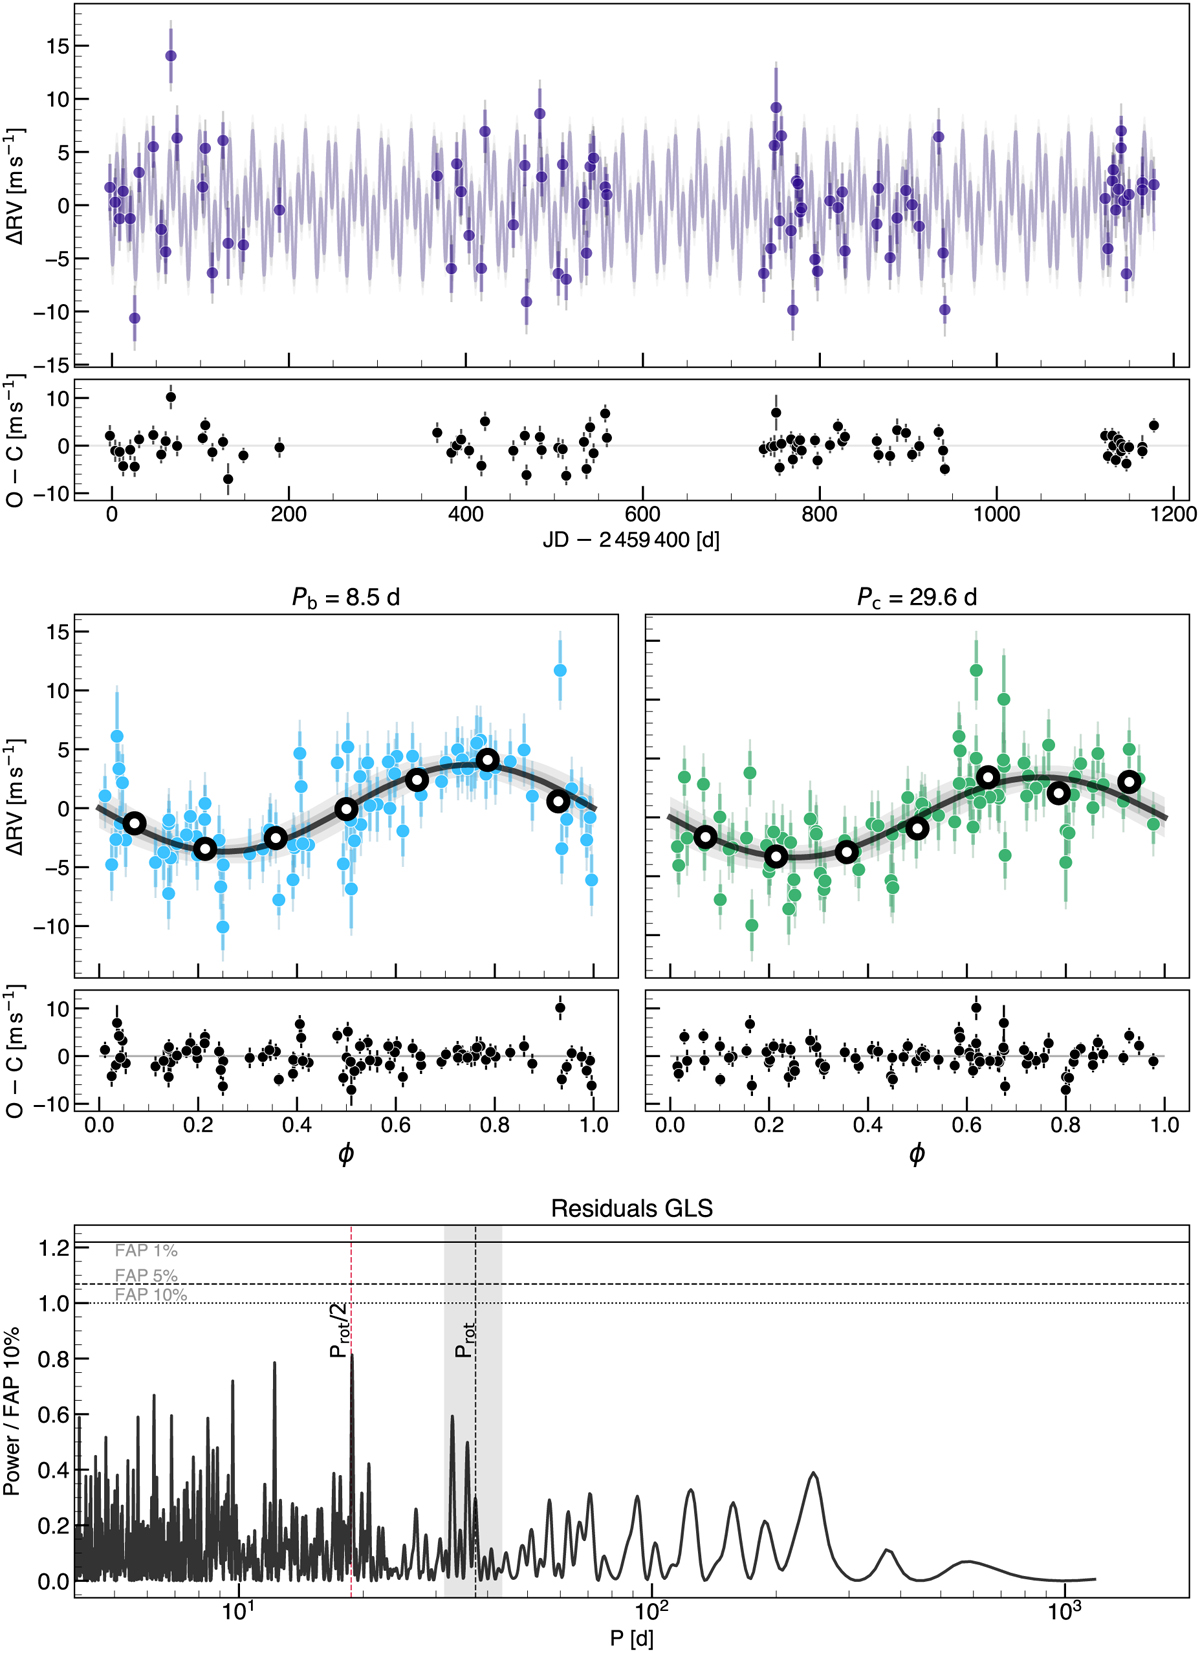
S-BART RV time series (top panel, purple dots) and phase-folded for both planets separately (blue dots in middle-left panel for KOBE-1 b, and green dots in the middle-right panel for KOBE-1 c). The quadratic trend, and the model of the other planet when plotted in phase (middle panels), are subtracted from the RVs. The best model is shown as a solid line, with shaded background regions representing 1- and 2σ confidence intervals. Error bars show the σRV (darker and thicker), and the σjit (lighter and thinner). The residuals of the model are shown in the panels below. Binned measurements in the middle panels are shown as black circles. Bottom: GLS periodogram from the residuals of the model. The grey shaded region indicates the stellar rotational period within 1σ, and its half is shown in dashed red vertical line. False alarm probabilities are indicated with horizontal black lines.
Current usage metrics show cumulative count of Article Views (full-text article views including HTML views, PDF and ePub downloads, according to the available data) and Abstracts Views on Vision4Press platform.
Data correspond to usage on the plateform after 2015. The current usage metrics is available 48-96 hours after online publication and is updated daily on week days.
Initial download of the metrics may take a while.