Fig. E.1
Download original image
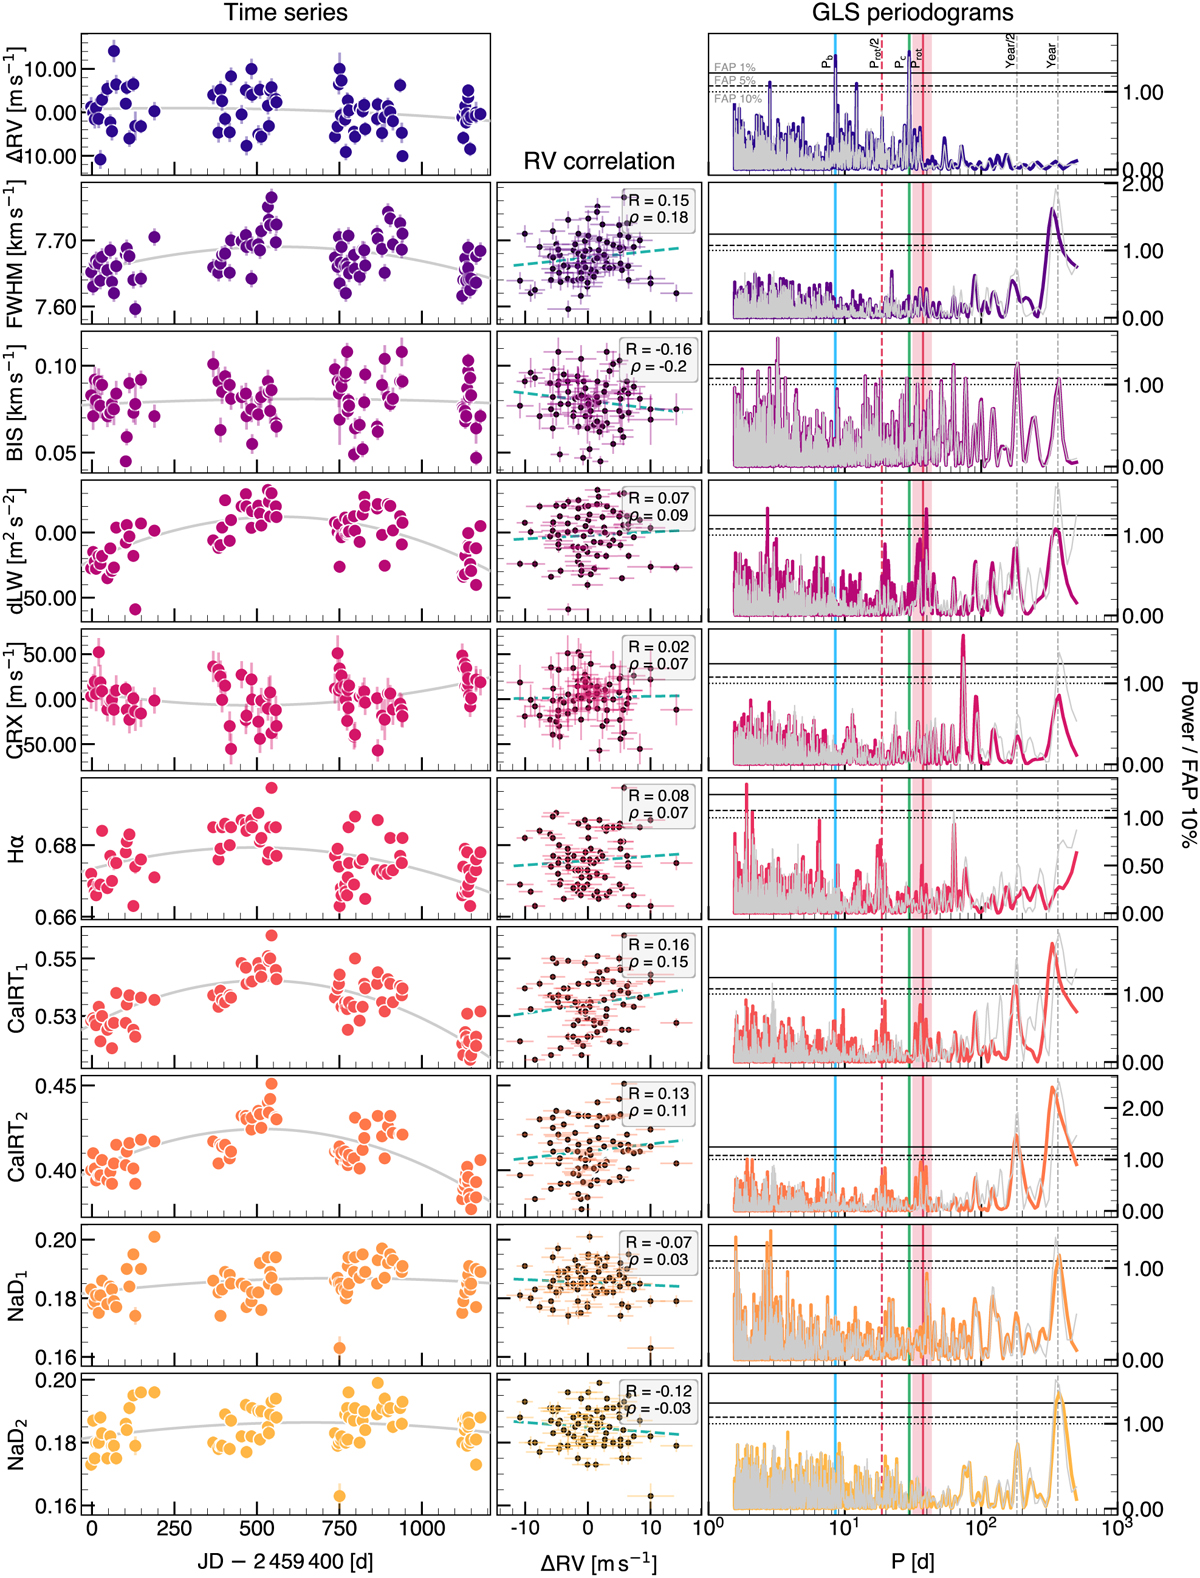
CARMENES data. Left: Time series for the S-BART RVs and the spectroscopic activity indicators. The grey line shows a quadratic trend fit. Center: Activity indicator and RV correlation, with a linear fit shown in dashed blue line, and the correlation coefficients (R from Pearson, and ρ from Spearman) indicated in the grey box. Right: GLS periodogram to the time series of the same row. The grey line corresponds to the non-detrended time series, while colored lines correspond to the same dataset after subtracting the fitted quadratic function. Vertical lines indicate the periodicities of the planets (blue and green), the rotational period (red region, see Sect. 3.2) and its half (dashed red line), and the duration of the year and its half (dashed grey lines). Horizontal lines show different false alarm probabilities as indicated in the top panel.
Current usage metrics show cumulative count of Article Views (full-text article views including HTML views, PDF and ePub downloads, according to the available data) and Abstracts Views on Vision4Press platform.
Data correspond to usage on the plateform after 2015. The current usage metrics is available 48-96 hours after online publication and is updated daily on week days.
Initial download of the metrics may take a while.