Fig. 15
Download original image
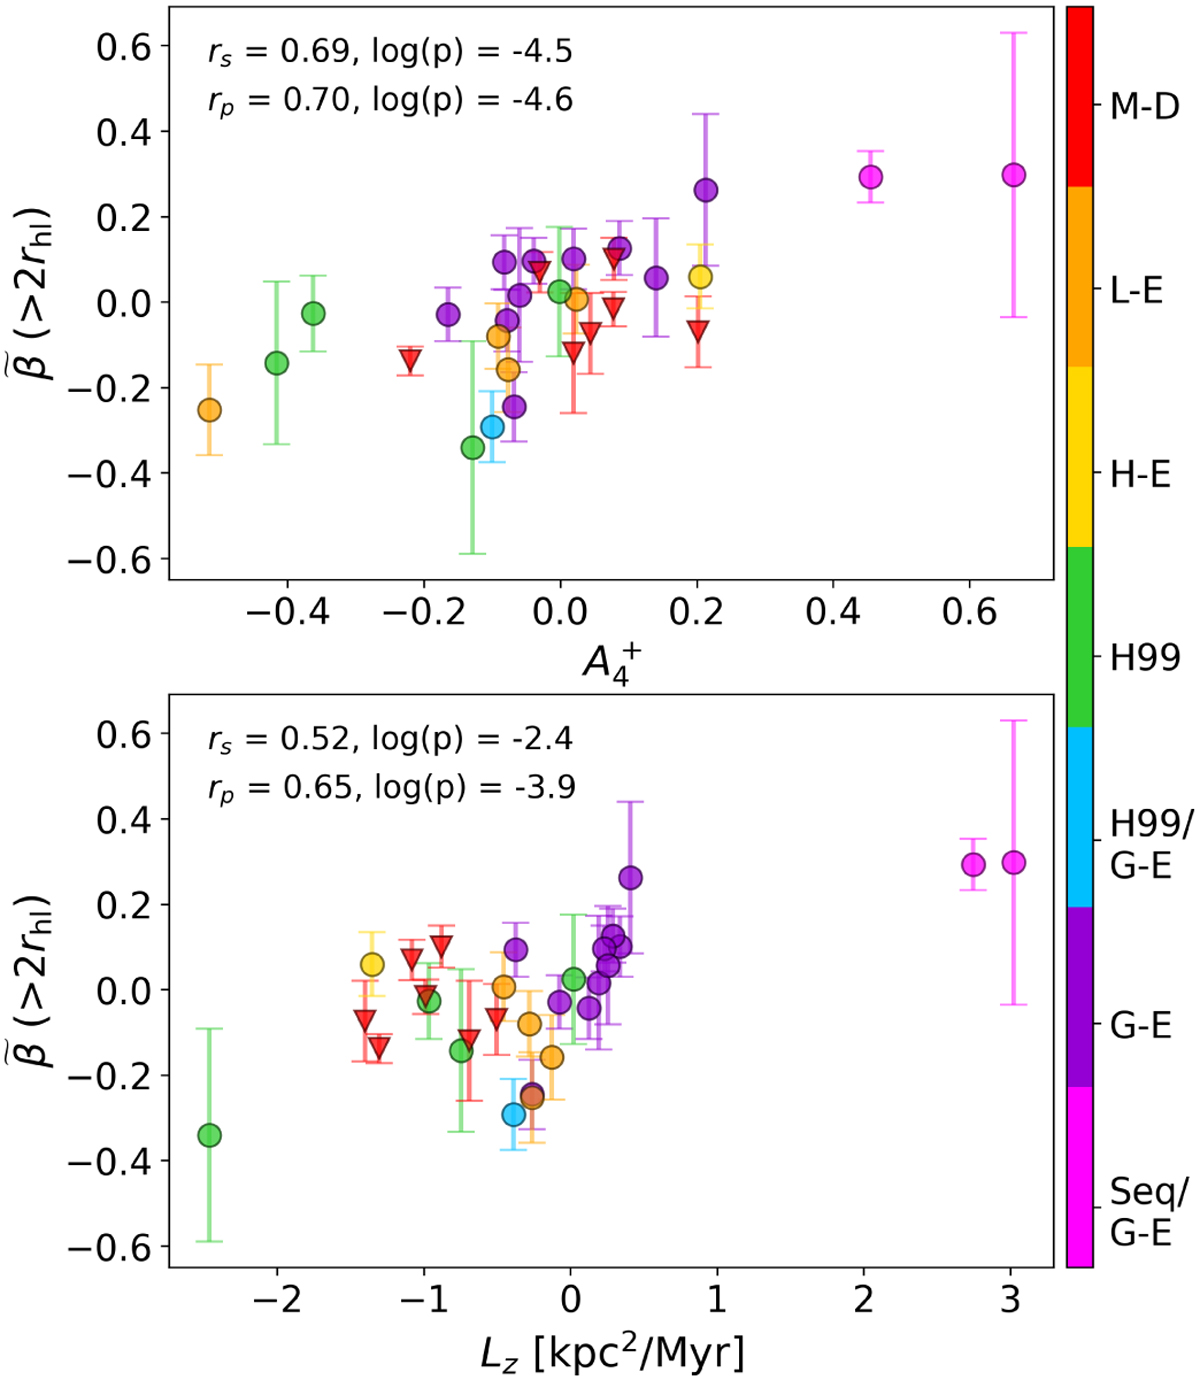
Average normalised anisotropy in the outer regions (>2rhl) using only Gaia proper motions, without removing the contribution by rotation. Top panel: the correlation with the cumulative radial distribution parameter ![]() (Leitinger et al. 2023), and bottom panel: the correlation against the z-component of the angular momentum, where positive (negative) values indicate retrograde (prograde) orbits. Clusters are colour-coded by their progenitor structures, as classified by Massari et al. (2019). M-D: main disc of the Milky Way progenitor, L-E: unassociated low-energy group, H-E: high-energy unassociated group, H99: Helmi streams, G-E: Gaia-Enceladus, Seq: Sequoia. Each panel also shows the Spearman and Pearson rank correlation coefficients for each parameter, with corresponding log p-values to show the significance of the correlations (log(p) ≤ −1.3 indicates a p-value ≤0.05, meaning the correlation is statistically significant and not likely to be the result of random chance).
(Leitinger et al. 2023), and bottom panel: the correlation against the z-component of the angular momentum, where positive (negative) values indicate retrograde (prograde) orbits. Clusters are colour-coded by their progenitor structures, as classified by Massari et al. (2019). M-D: main disc of the Milky Way progenitor, L-E: unassociated low-energy group, H-E: high-energy unassociated group, H99: Helmi streams, G-E: Gaia-Enceladus, Seq: Sequoia. Each panel also shows the Spearman and Pearson rank correlation coefficients for each parameter, with corresponding log p-values to show the significance of the correlations (log(p) ≤ −1.3 indicates a p-value ≤0.05, meaning the correlation is statistically significant and not likely to be the result of random chance).
Current usage metrics show cumulative count of Article Views (full-text article views including HTML views, PDF and ePub downloads, according to the available data) and Abstracts Views on Vision4Press platform.
Data correspond to usage on the plateform after 2015. The current usage metrics is available 48-96 hours after online publication and is updated daily on week days.
Initial download of the metrics may take a while.