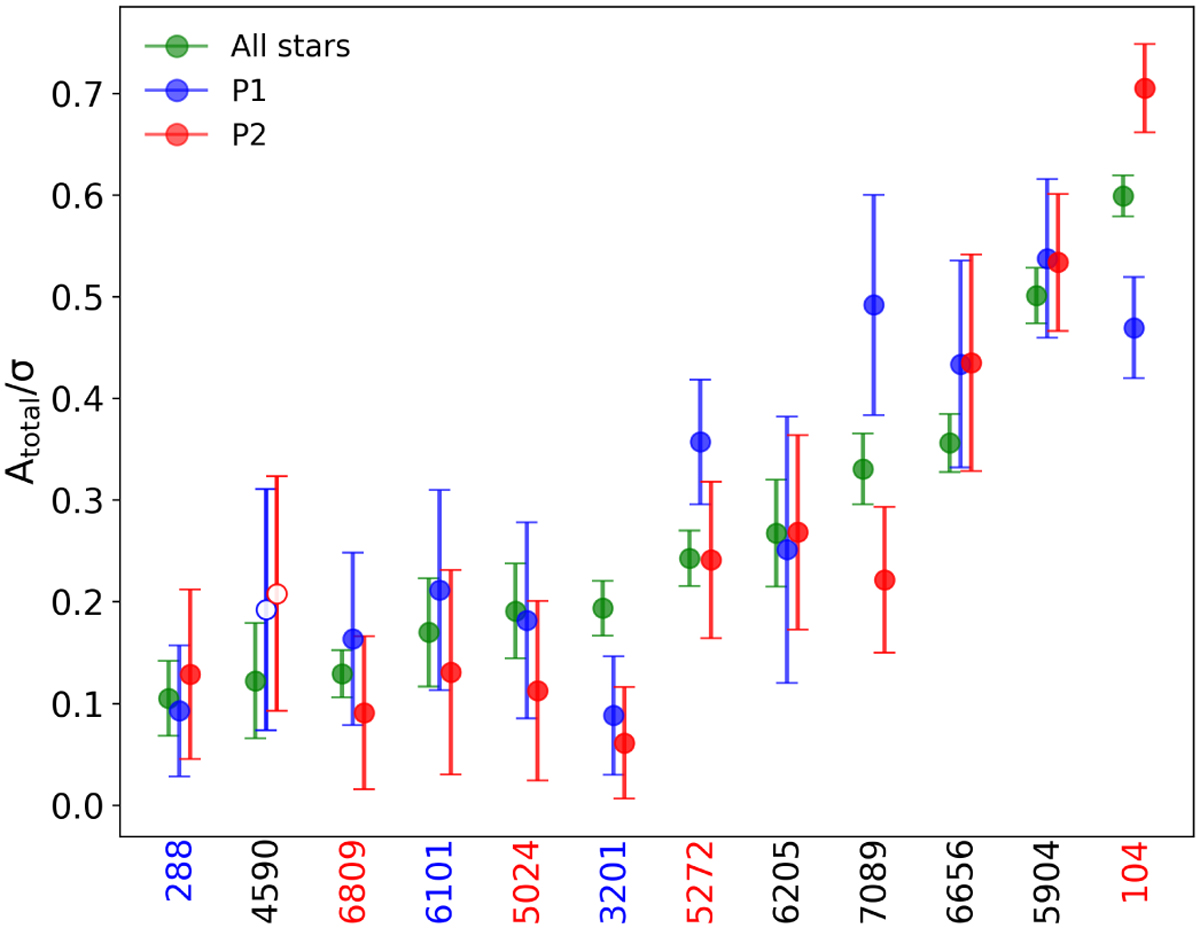
Fig. 13
Download original image
Total rotational amplitudes divided by the velocity dispersion for the P1 (blue) and P2 (red) stars for each of the dynamically young clusters in our sample, as well as for all stars (green) as described in Section 3.1 and listed in Table A.1. Solid circles indicate that both populations contain enough stars with LOS velocities for a statistically robust result (NLOS,P1 + NLOS,P2 > 300), while open circles indicate the opposite. Cluster names are colour-coded based on whether the cluster has a significant P1 (blue) central concentration, P2 (red) central concentration or are spatially mixed (black). Clusters are ordered based on the Atotal/σ values derived using all available stars as listed in Table A.1, such that clusters on the left (right) have lower (higher) rotation.
Current usage metrics show cumulative count of Article Views (full-text article views including HTML views, PDF and ePub downloads, according to the available data) and Abstracts Views on Vision4Press platform.
Data correspond to usage on the plateform after 2015. The current usage metrics is available 48-96 hours after online publication and is updated daily on week days.
Initial download of the metrics may take a while.