Fig. 12
Download original image
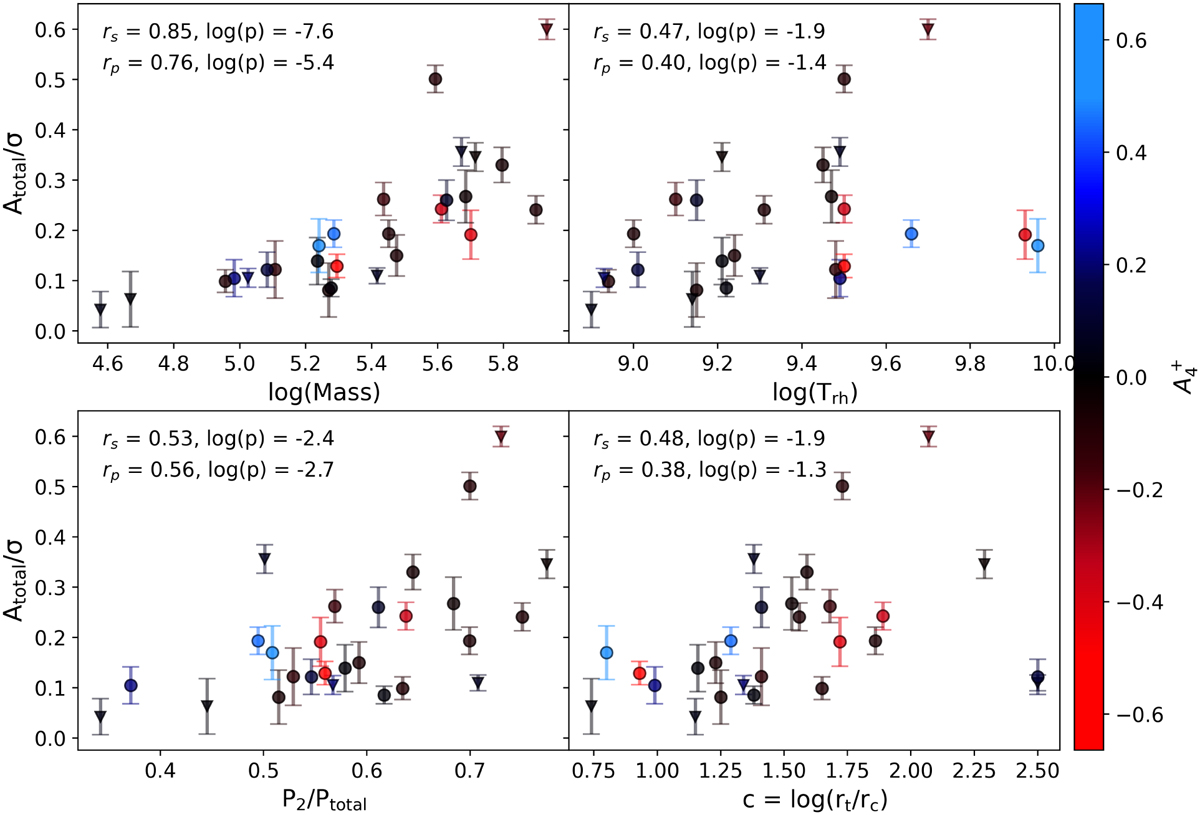
Rotation over dispersion ratio Atotal/σ as a function of: current mass (top left) (Baumgardt et al. 2023b), relaxation time (top right) (Baumgardt et al. 2023b), enriched star fraction (bottom left) (Leitinger et al. 2023) and concentration parameter (bottom right) (Harris 2010). Clusters are colour-coded by ![]() values (Leitinger et al. 2023) and each panel shows the Spearman and Pearson rank correlation coefficients for each parameter, with corresponding log p-values to show the significance of the correlations (log(p) ≤ −1.3 indicates a p-value ≤ 0.05, meaning the correlation is statistically significant and not a result of random chance).
values (Leitinger et al. 2023) and each panel shows the Spearman and Pearson rank correlation coefficients for each parameter, with corresponding log p-values to show the significance of the correlations (log(p) ≤ −1.3 indicates a p-value ≤ 0.05, meaning the correlation is statistically significant and not a result of random chance).
Current usage metrics show cumulative count of Article Views (full-text article views including HTML views, PDF and ePub downloads, according to the available data) and Abstracts Views on Vision4Press platform.
Data correspond to usage on the plateform after 2015. The current usage metrics is available 48-96 hours after online publication and is updated daily on week days.
Initial download of the metrics may take a while.