Fig. 9.
Download original image
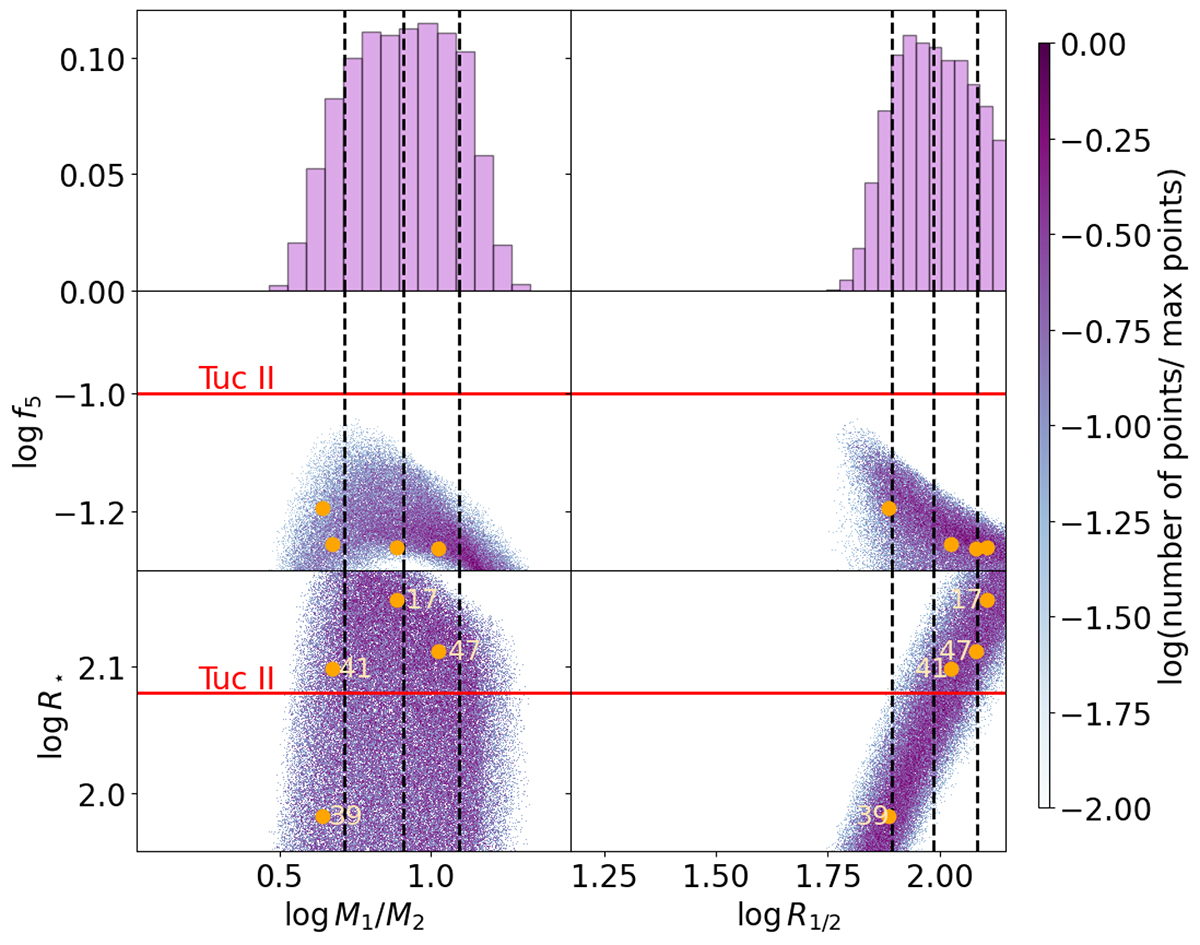
Distributions of the input couple R1/2 and M1/M2 that give f5 and R⋆ simultaneously consistent with the observations from Tucana II. Similarly to Fig. 8, the red line gives the average value inferred from observations, but the ranges for f5 and R⋆ were cut to include only the observational uncertainty, i.e., f5TucII = 10 ± 5% (Chiti et al. 2021) and ![]() pc (Bechtol et al. 2015), respectively. The orange points are the post-merger galaxies consistent with observations from Tucana II, and are numbered with their simulation ID.
pc (Bechtol et al. 2015), respectively. The orange points are the post-merger galaxies consistent with observations from Tucana II, and are numbered with their simulation ID.
Current usage metrics show cumulative count of Article Views (full-text article views including HTML views, PDF and ePub downloads, according to the available data) and Abstracts Views on Vision4Press platform.
Data correspond to usage on the plateform after 2015. The current usage metrics is available 48-96 hours after online publication and is updated daily on week days.
Initial download of the metrics may take a while.