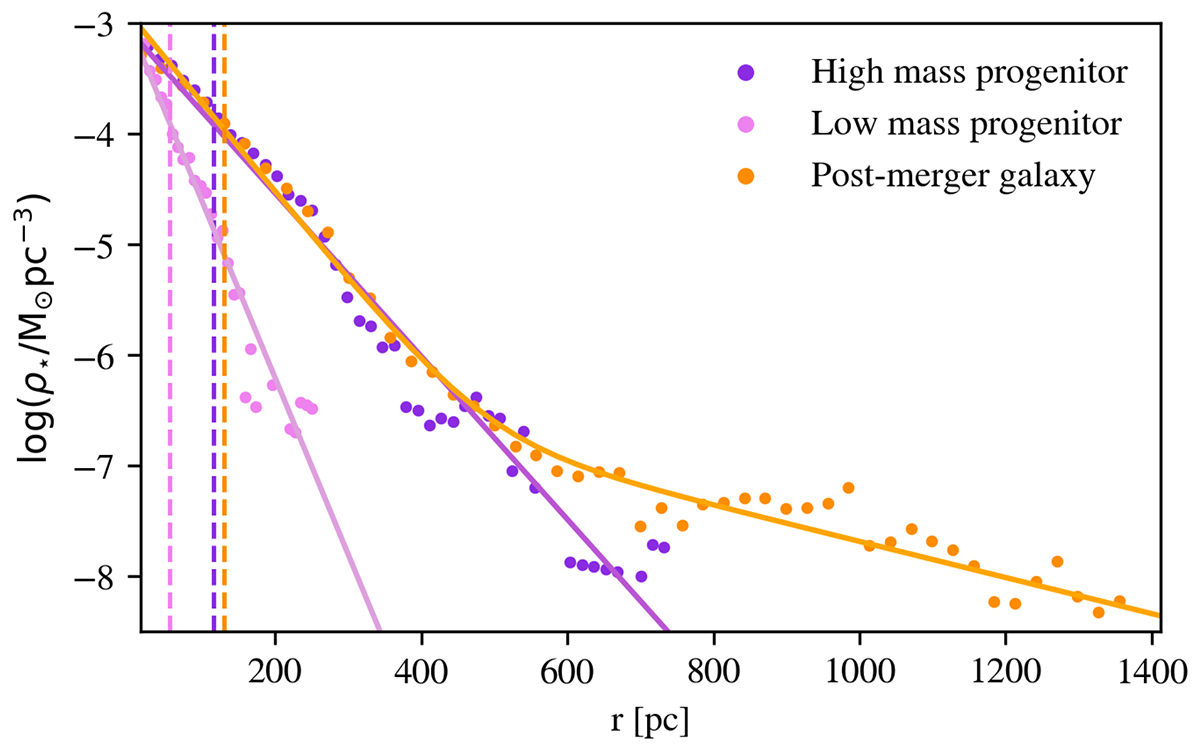
Fig. 6.
Download original image
Example of pre- vs. post-merging stellar distributions. We show the profile for the simulation selected for Fig. 5 by reporting ρ⋆ for the two progenitors with shades of purple and the post-merger galaxy in orange. The solid lines are the fit profile, which is exponential (Eq. (4)) and a sum of exponential for the progenitors and the post-merger galaxy, respectively. The vertical lines mark the half-mass radius for each galaxy.
Current usage metrics show cumulative count of Article Views (full-text article views including HTML views, PDF and ePub downloads, according to the available data) and Abstracts Views on Vision4Press platform.
Data correspond to usage on the plateform after 2015. The current usage metrics is available 48-96 hours after online publication and is updated daily on week days.
Initial download of the metrics may take a while.