Fig. 5.

Download original image
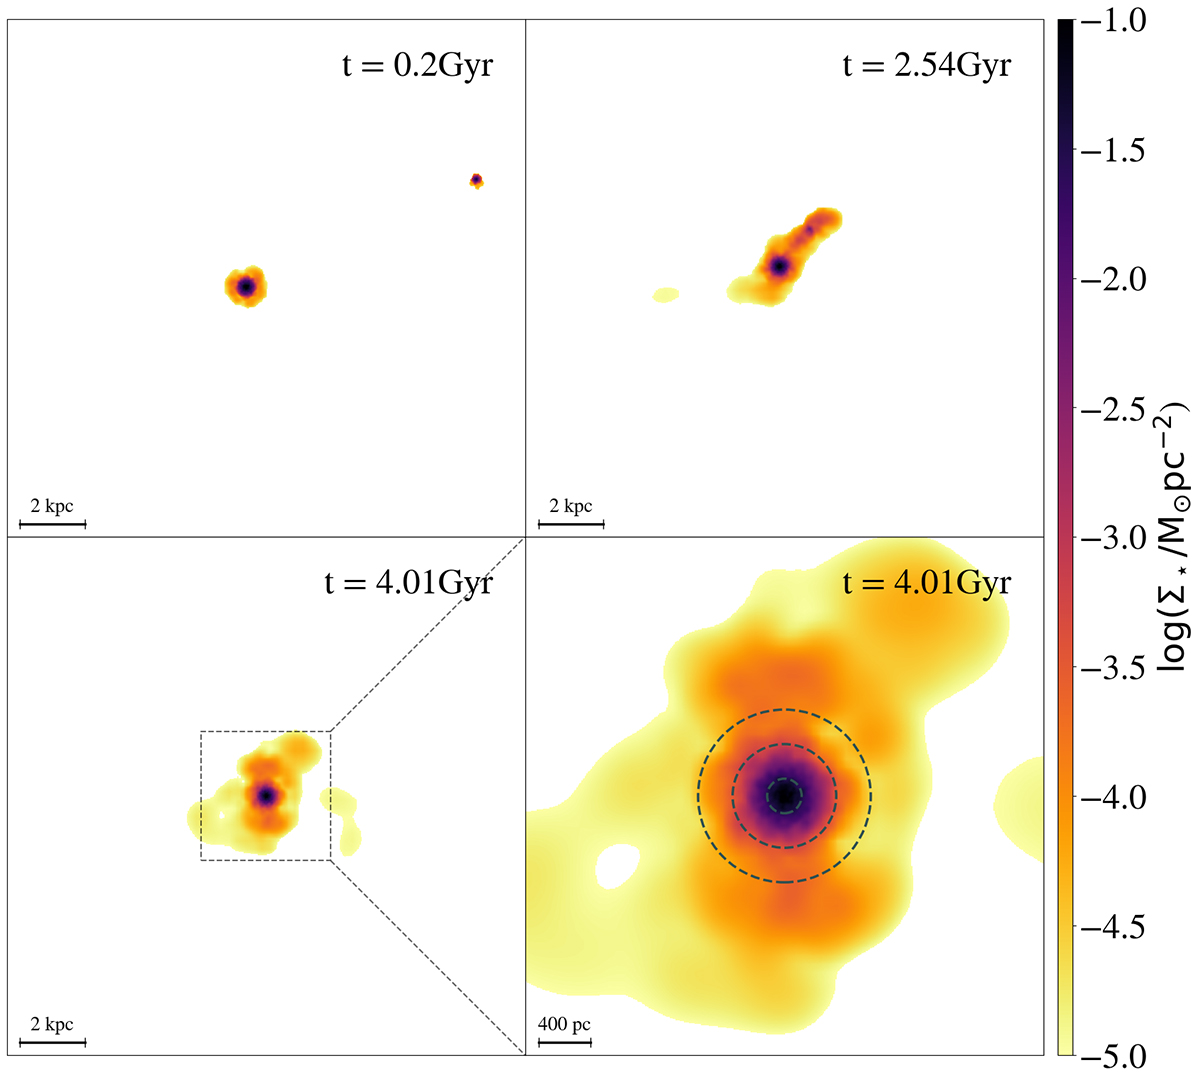
Example of merger evolution. The different panels report the stellar surface density (Σ⋆) maps at various evolutionary stages for progenitors with a M1/M2 ≃ 10 (profile in Fig. 1) and the merger setup in Fig. 2. The bottom right panel is a zoom-in on the virialized post-merger galaxy, and the three dashed circles have radii of one, three, and five half-mass radii. After the merging, the resulting fraction of stars in the outskirts is f5 ∼ 5.5%.
Current usage metrics show cumulative count of Article Views (full-text article views including HTML views, PDF and ePub downloads, according to the available data) and Abstracts Views on Vision4Press platform.
Data correspond to usage on the plateform after 2015. The current usage metrics is available 48-96 hours after online publication and is updated daily on week days.
Initial download of the metrics may take a while.


