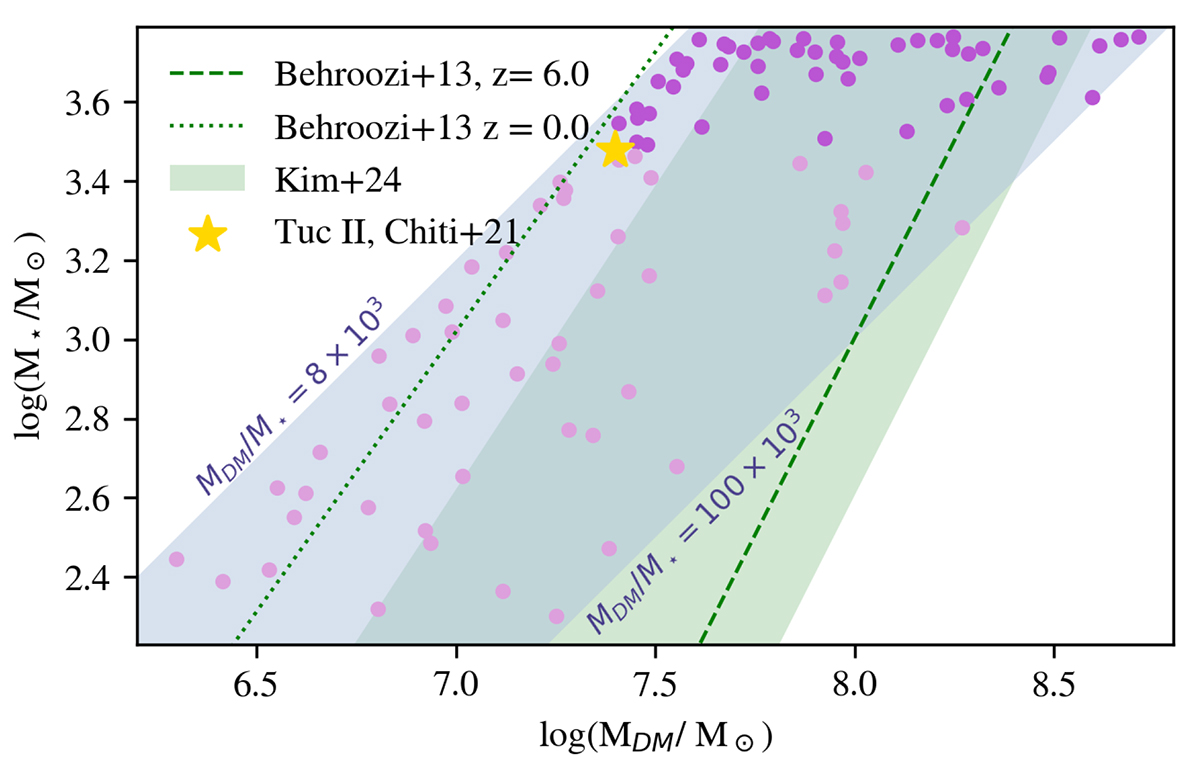
Fig. 3.
Download original image
Parameter sampling in the dark matter (MDM) vs. stellar mass (M⋆) plane. Each pink (purple) point represents the least (more) massive progenitor in a merging simulation. The shaded blue region indicates the dark matter to stellar mass (MDM/M⋆) interval explored by the suite. The gold star shows the estimate of Tucana II from Chiti et al. (2021) observations, while the green lines are the extrapolation from the abundance matching model from Behroozi et al. (2013) at redshift z = 0 and 6. The shaded green region represents the extrapolation of the scatter in the stellar-mass to halo-mass relation measured by Kim et al. (2024) for dwarf galaxies.
Current usage metrics show cumulative count of Article Views (full-text article views including HTML views, PDF and ePub downloads, according to the available data) and Abstracts Views on Vision4Press platform.
Data correspond to usage on the plateform after 2015. The current usage metrics is available 48-96 hours after online publication and is updated daily on week days.
Initial download of the metrics may take a while.