Fig. 2.
Download original image
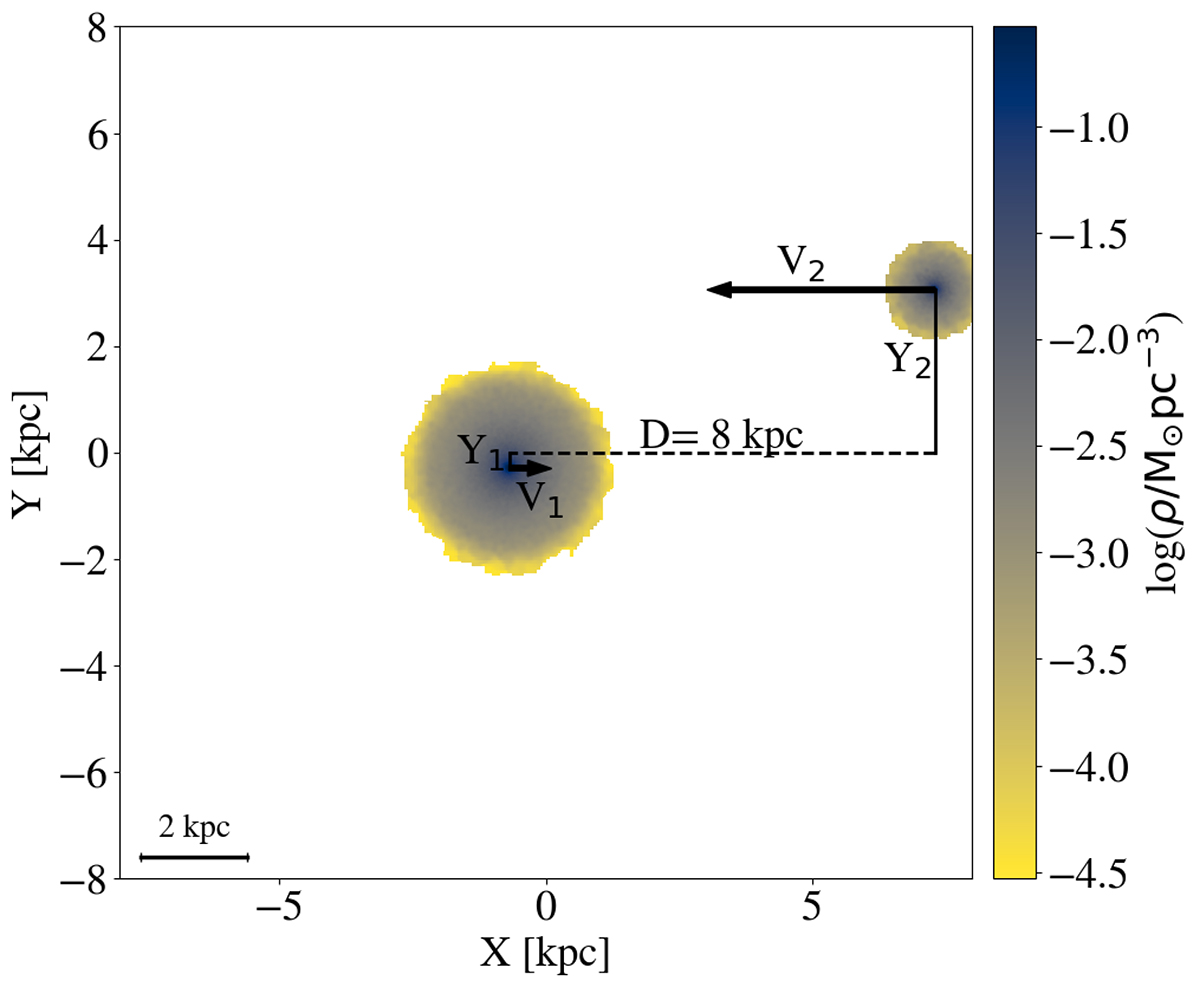
Example of merger ICs prepared with DICE (see Sect. 2.1.4). The density map in the X − Y plane shows the total (dark matter+stars) density (ρ) that has been mass-averaged along the Z axis. The two progenitors were placed in the simulation box at a distance of D = 8 kpc along the X axis and with an impact parameter of |Y1|+|Y2| (Eq. (5b)). The arrows mark the direction of the initial velocity of each progenitor (Eq. (5c)).
Current usage metrics show cumulative count of Article Views (full-text article views including HTML views, PDF and ePub downloads, according to the available data) and Abstracts Views on Vision4Press platform.
Data correspond to usage on the plateform after 2015. The current usage metrics is available 48-96 hours after online publication and is updated daily on week days.
Initial download of the metrics may take a while.