Fig. A.1.
Download original image
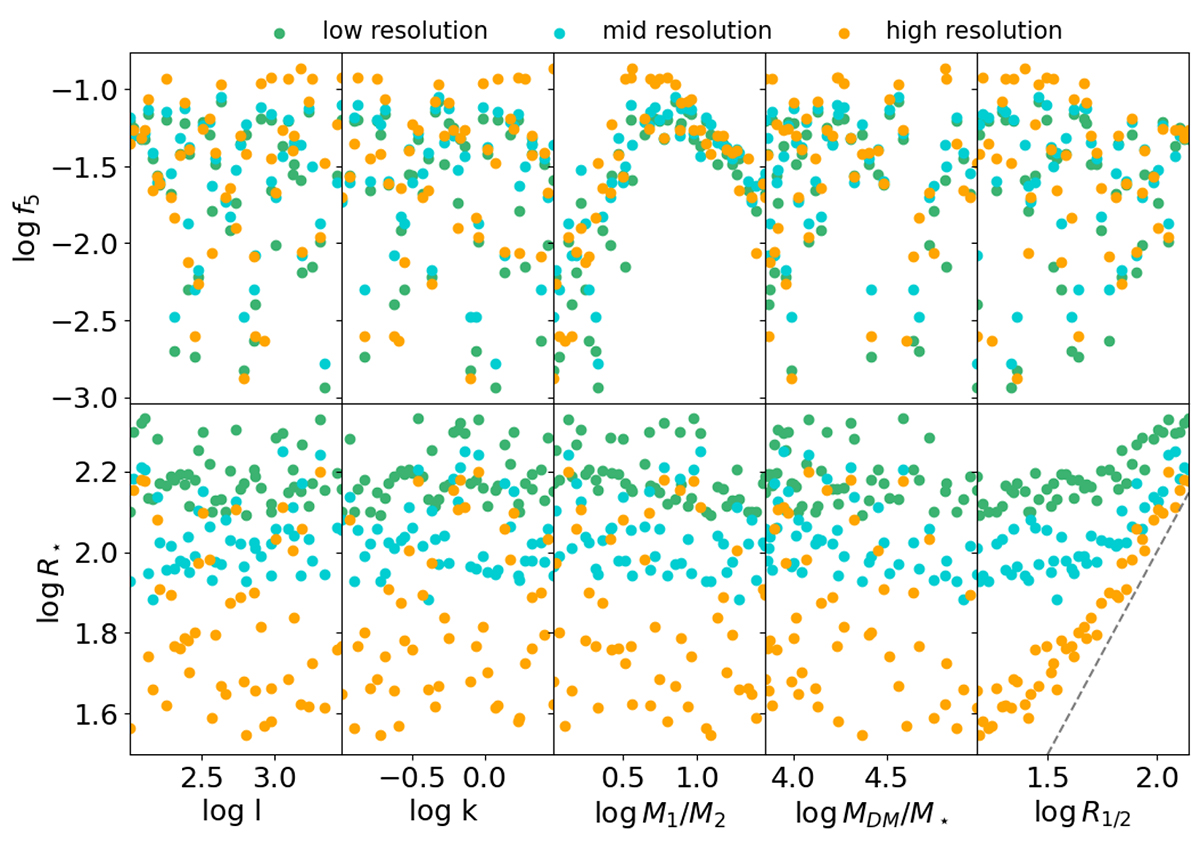
Comparison of the distribution of the post-merger galaxies properties, i.e., half-mass radius R⋆ (bottom row) and the fraction of stars f5 beyond 5R⋆ (top row), changing the dark matter and stellar resolution. Each column represents an IC property explored in this work, from left to right are: specific angular momentum l, specific kinetic energy k, merger mass ratio M1/M2, dark matter abundance MDM/M⋆, and progenitor half-mass radius R1/2. The dashed line in the bottom right corner is R⋆ = R1/2. The low-resolution simulations (mDM = 103 M⊙, mDM/m⋆ = 103 M⊙) are in green, the mid-resolution simulations are in blue (mDM = 103 M⊙, mDM/m⋆ = 102 M⊙), while the high-resolution simulations (![]() , mDM/m⋆ = 102 M⊙) are in orange.
, mDM/m⋆ = 102 M⊙) are in orange.
Current usage metrics show cumulative count of Article Views (full-text article views including HTML views, PDF and ePub downloads, according to the available data) and Abstracts Views on Vision4Press platform.
Data correspond to usage on the plateform after 2015. The current usage metrics is available 48-96 hours after online publication and is updated daily on week days.
Initial download of the metrics may take a while.