Fig. 10.
Download original image
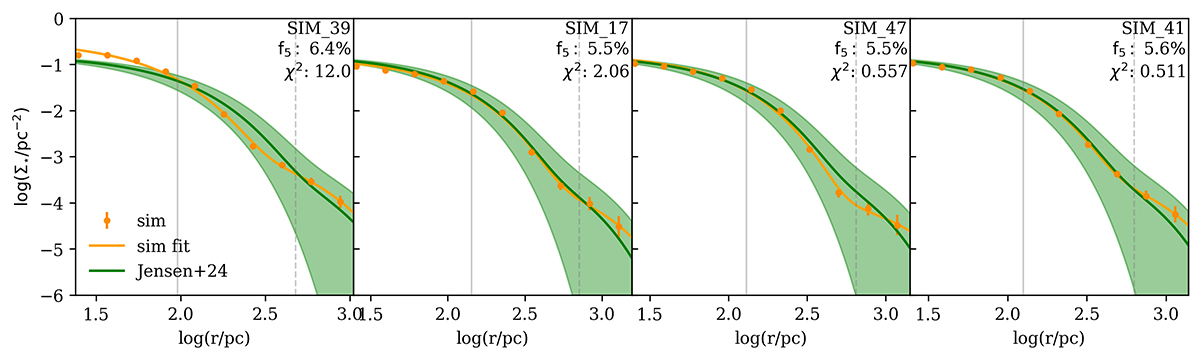
Comparison of the observed stellar number density distribution of Tucana II and the simulations with the f5 and R1/2 parameters closest to the observed values (f5TucII = 10 ± 5% from Chiti et al. 2021 and ![]() from Bechtol et al. 2015). Each panel shows a different simulation, as is indicated in the inset, ordered by decreasing χ2 value. The green line (shaded area) gives the mode (error) of the profile for Tucana II, observed by Jensen et al. (2024). The orange line (points with bars) gives the best fit (average and standard deviation of the data points) of the profile of a simulated post-merger galaxy, obtained by adopting a two-exponential profile (Eq. (11)). The solid (dashed) gray line shows the R⋆ (5 R⋆) post-merger radius.
from Bechtol et al. 2015). Each panel shows a different simulation, as is indicated in the inset, ordered by decreasing χ2 value. The green line (shaded area) gives the mode (error) of the profile for Tucana II, observed by Jensen et al. (2024). The orange line (points with bars) gives the best fit (average and standard deviation of the data points) of the profile of a simulated post-merger galaxy, obtained by adopting a two-exponential profile (Eq. (11)). The solid (dashed) gray line shows the R⋆ (5 R⋆) post-merger radius.
Current usage metrics show cumulative count of Article Views (full-text article views including HTML views, PDF and ePub downloads, according to the available data) and Abstracts Views on Vision4Press platform.
Data correspond to usage on the plateform after 2015. The current usage metrics is available 48-96 hours after online publication and is updated daily on week days.
Initial download of the metrics may take a while.