Fig. 8.
Download original image
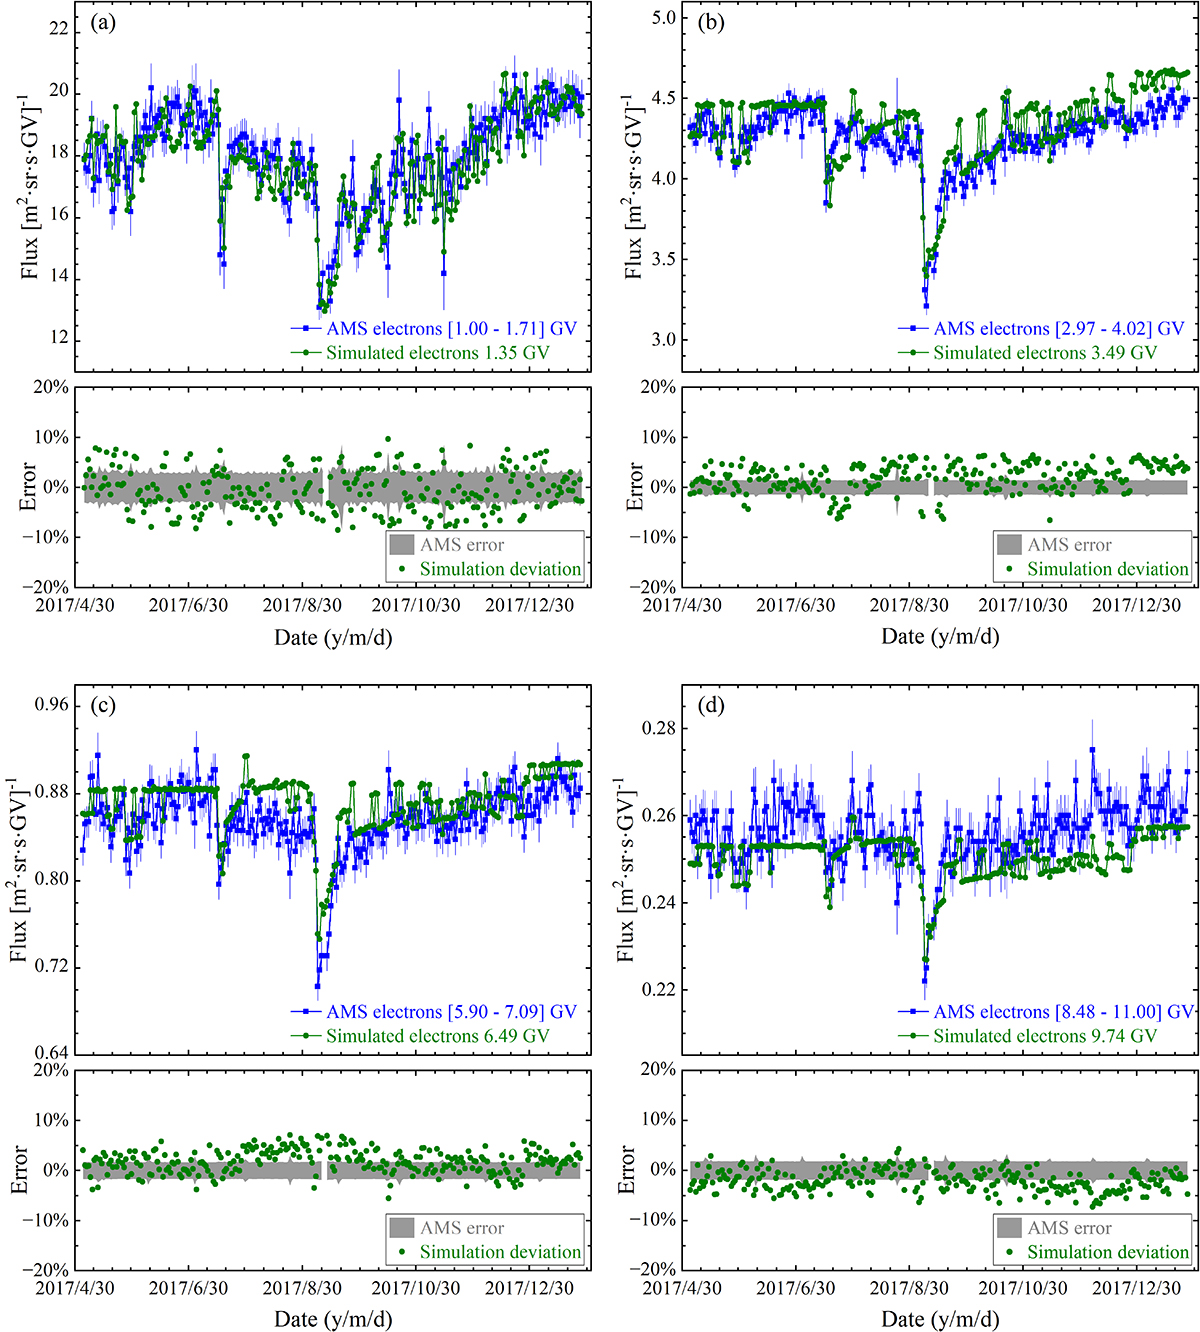
Comparison between simulated electron fluxes at 1.35 GV, 3.49 GV, 6.49 GV, 9.74 GV (dark green points) and AMS observed electron fluxes at [1.00–1.71] GV, [2.97–4.02] GV, [5.90–7.09] GV, and [8.48–11.00] GV (blue squares) with error bars and corresponding AMS observation error (gray shadow areas), along with the simulation deviation (dark green points) from May 5, 2017 to January 27, 2018.
Current usage metrics show cumulative count of Article Views (full-text article views including HTML views, PDF and ePub downloads, according to the available data) and Abstracts Views on Vision4Press platform.
Data correspond to usage on the plateform after 2015. The current usage metrics is available 48-96 hours after online publication and is updated daily on week days.
Initial download of the metrics may take a while.