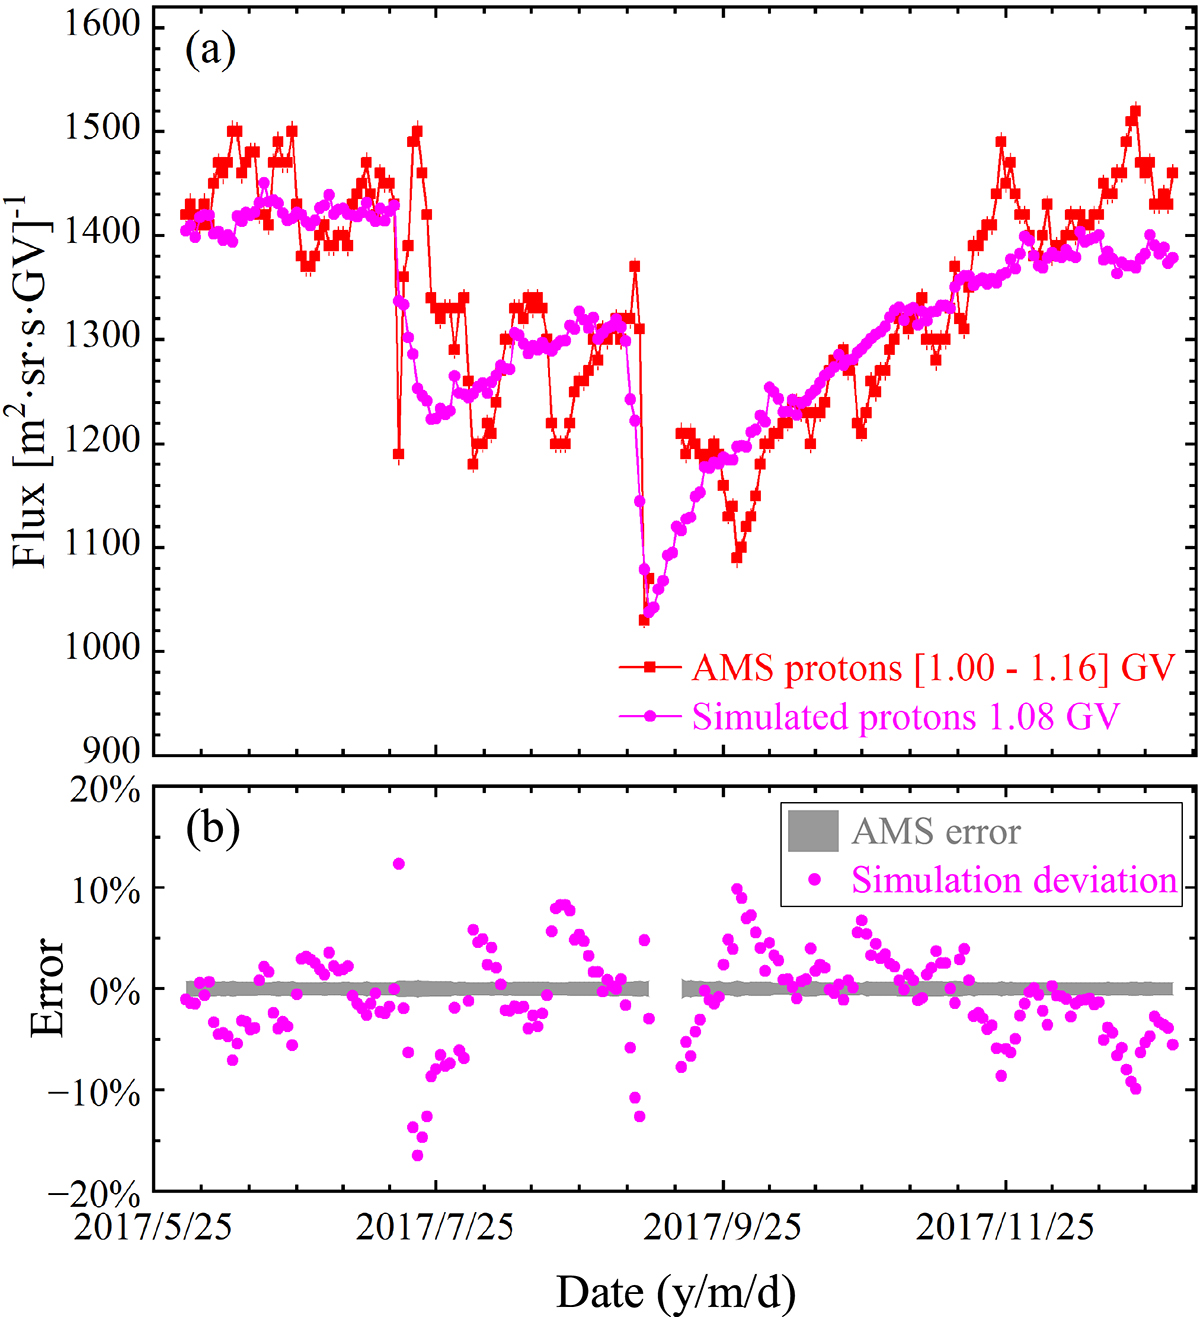
Fig. 6.
Download original image
Simulated proton fluxes using DBs shown in Fig. 5 and invariant parameters in the expressions of diffusion coefficients, as well as AMS observations of protons and the deviation of the two. Panel (a): [1.00–1.16] GV proton fluxes from AMS observation (red squares) with error bar and simulated 1.08 GV proton fluxes (magenta points) from June 1, 2017 to December 31, 2017. Panel (b): AMS observation error (gray shadow area) for [1.00–1.16] GV proton fluxes and simulation deviation (magenta points) for 1.08 GV proton fluxes from June 1, 2017 to December 31, 2017.
Current usage metrics show cumulative count of Article Views (full-text article views including HTML views, PDF and ePub downloads, according to the available data) and Abstracts Views on Vision4Press platform.
Data correspond to usage on the plateform after 2015. The current usage metrics is available 48-96 hours after online publication and is updated daily on week days.
Initial download of the metrics may take a while.