Open Access
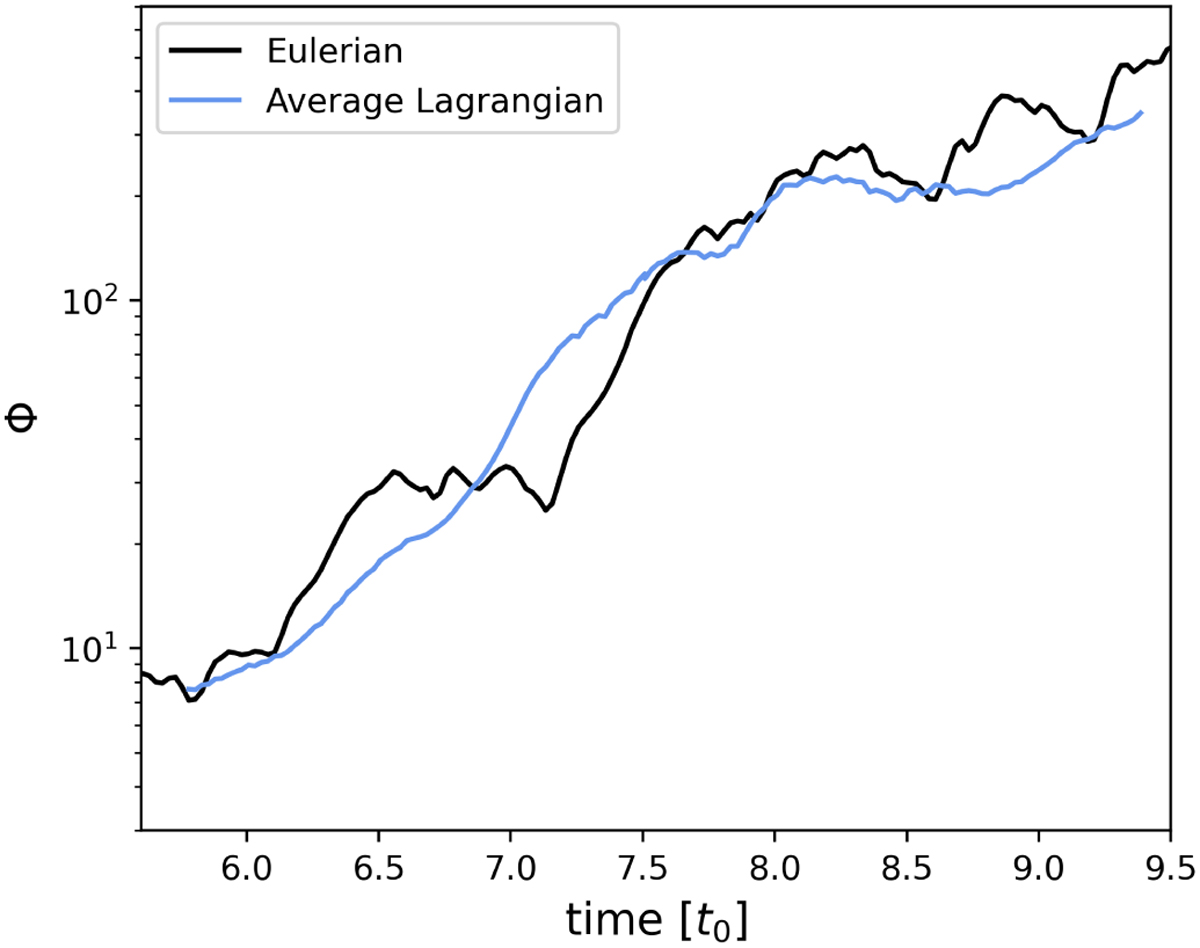
Fig. A.1
Download original image
Power evolution comparison between the Eulerian frame and the Lagrangian frame. The black curve shows the power evolution in the usual Eulerian frame and the blue curve shows the power evolution for the average Lagrangian frame, where the averaging was done for four different starting positions (see text).
Current usage metrics show cumulative count of Article Views (full-text article views including HTML views, PDF and ePub downloads, according to the available data) and Abstracts Views on Vision4Press platform.
Data correspond to usage on the plateform after 2015. The current usage metrics is available 48-96 hours after online publication and is updated daily on week days.
Initial download of the metrics may take a while.