Fig. 4
Download original image
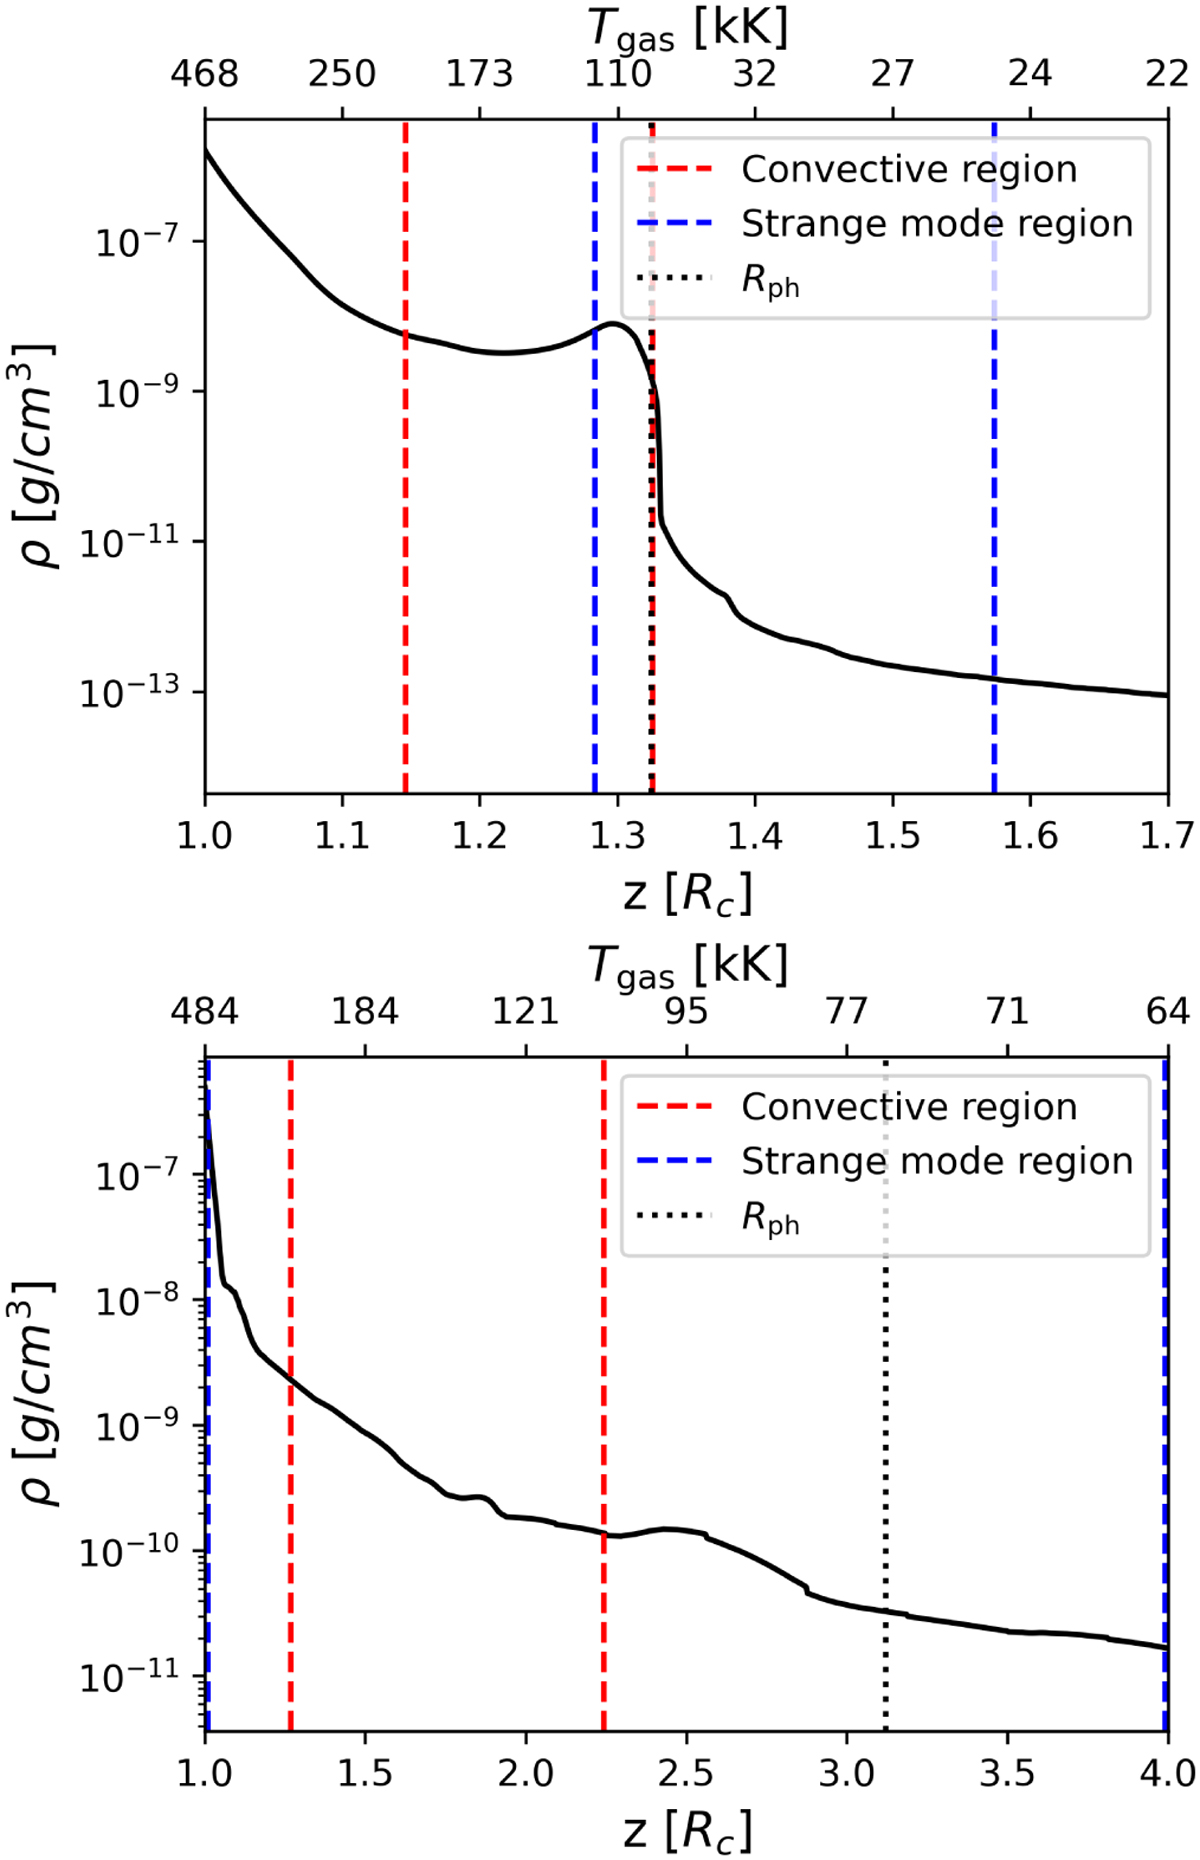
Average density profiles at t = 2t0 for the O4 model (top) and the WR model (bottom), with the vertical axis in logarithmic scale. The red dashed lines indicate the predicted convective region and the blue dashed lines indicate the predicted strange mode region. In the WR model, the whole domain is predicted to be unstable to strange modes, which we indicate by the blue dashed lines at the edges of the plot. The dotted black lines indicate the photosphere.
Current usage metrics show cumulative count of Article Views (full-text article views including HTML views, PDF and ePub downloads, according to the available data) and Abstracts Views on Vision4Press platform.
Data correspond to usage on the plateform after 2015. The current usage metrics is available 48-96 hours after online publication and is updated daily on week days.
Initial download of the metrics may take a while.