Fig. 3
Download original image
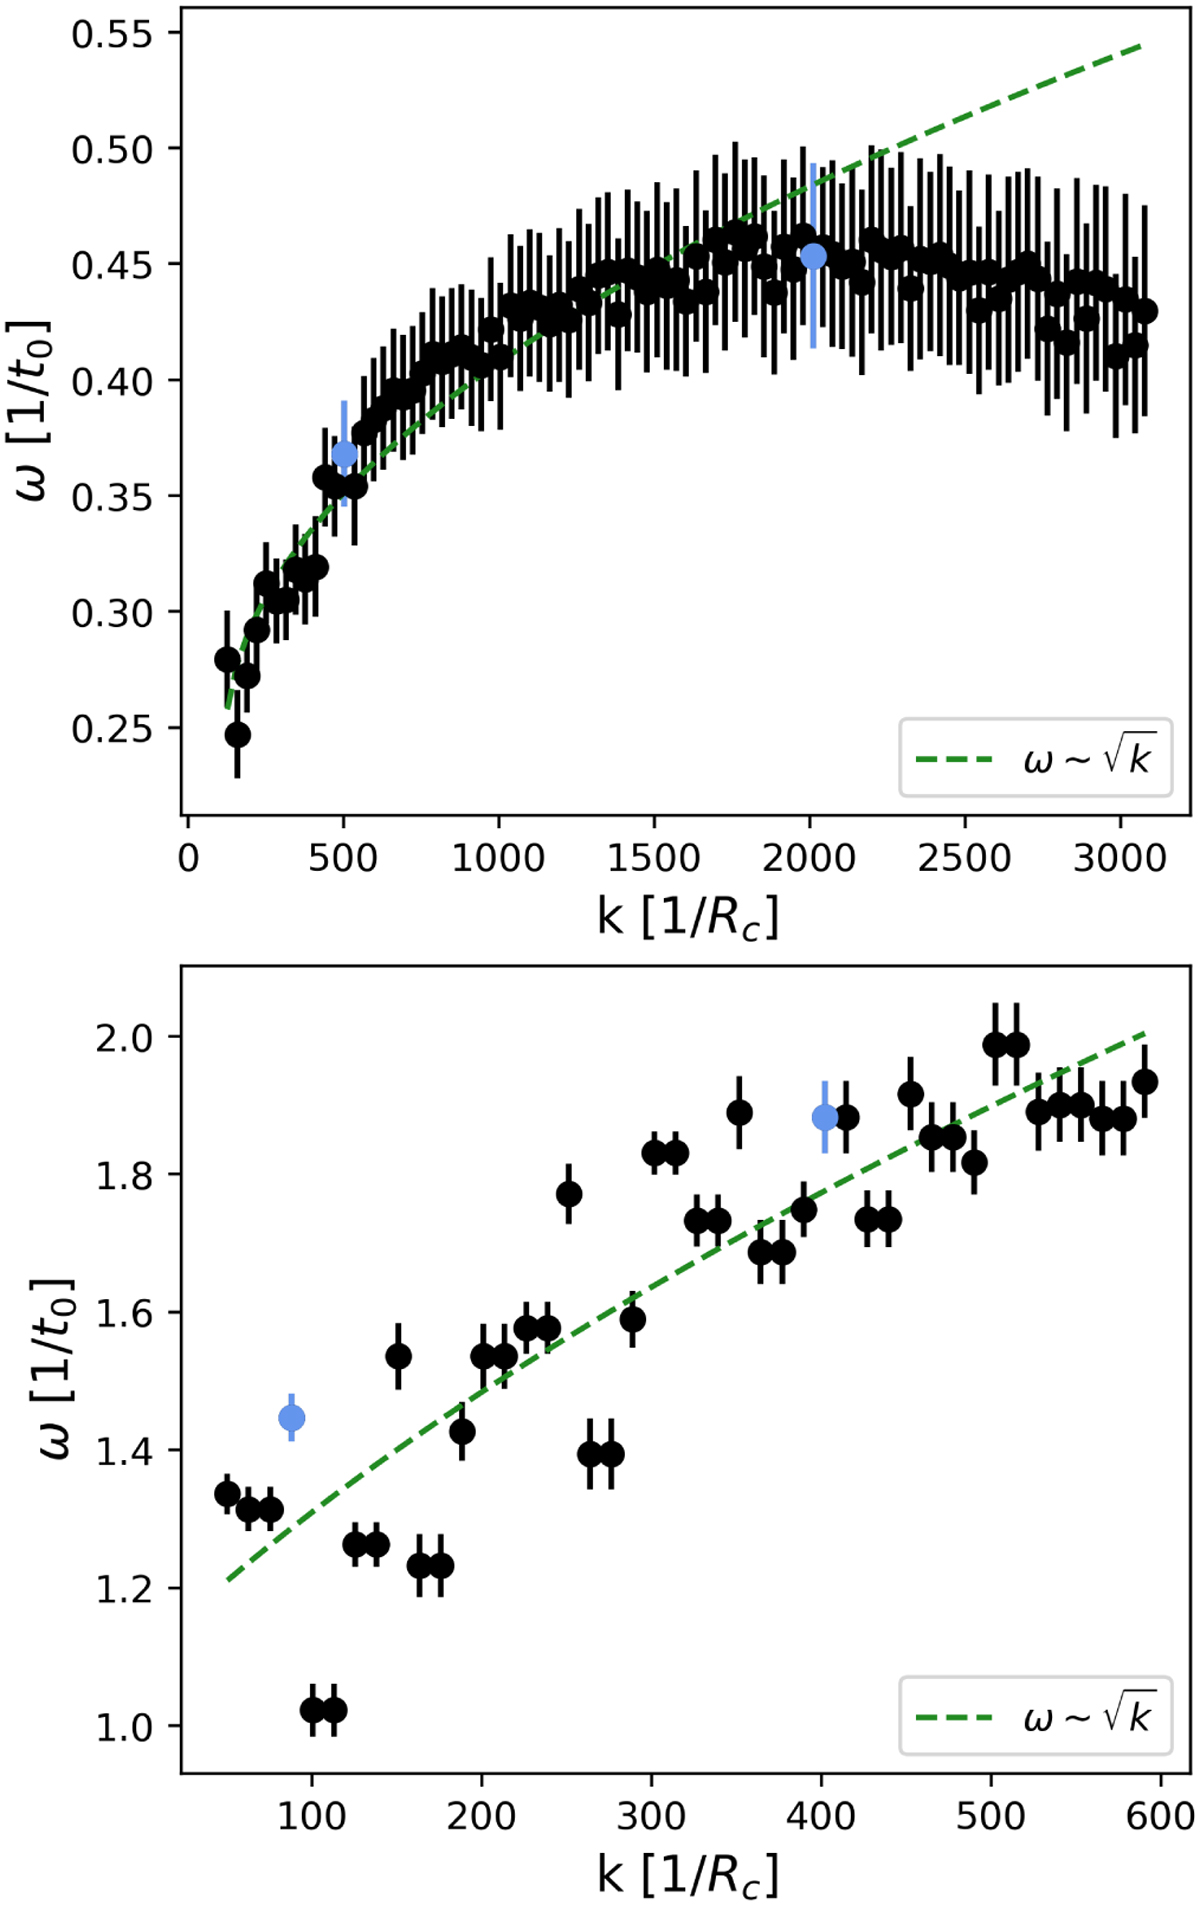
Growth rates calculated from the exponential fit of the density power evolution for multiple wavenumbers in the O4 model (top) and WR model (bottom). The blue dots correspond to the wavenumbers shown in Fig. 2. The errorbars on the growth rates are one standard deviation errors from the nonlinear least squares fitting. The green dashed line is a fit of ω(k).
Current usage metrics show cumulative count of Article Views (full-text article views including HTML views, PDF and ePub downloads, according to the available data) and Abstracts Views on Vision4Press platform.
Data correspond to usage on the plateform after 2015. The current usage metrics is available 48-96 hours after online publication and is updated daily on week days.
Initial download of the metrics may take a while.