Open Access
Fig. 2
Download original image
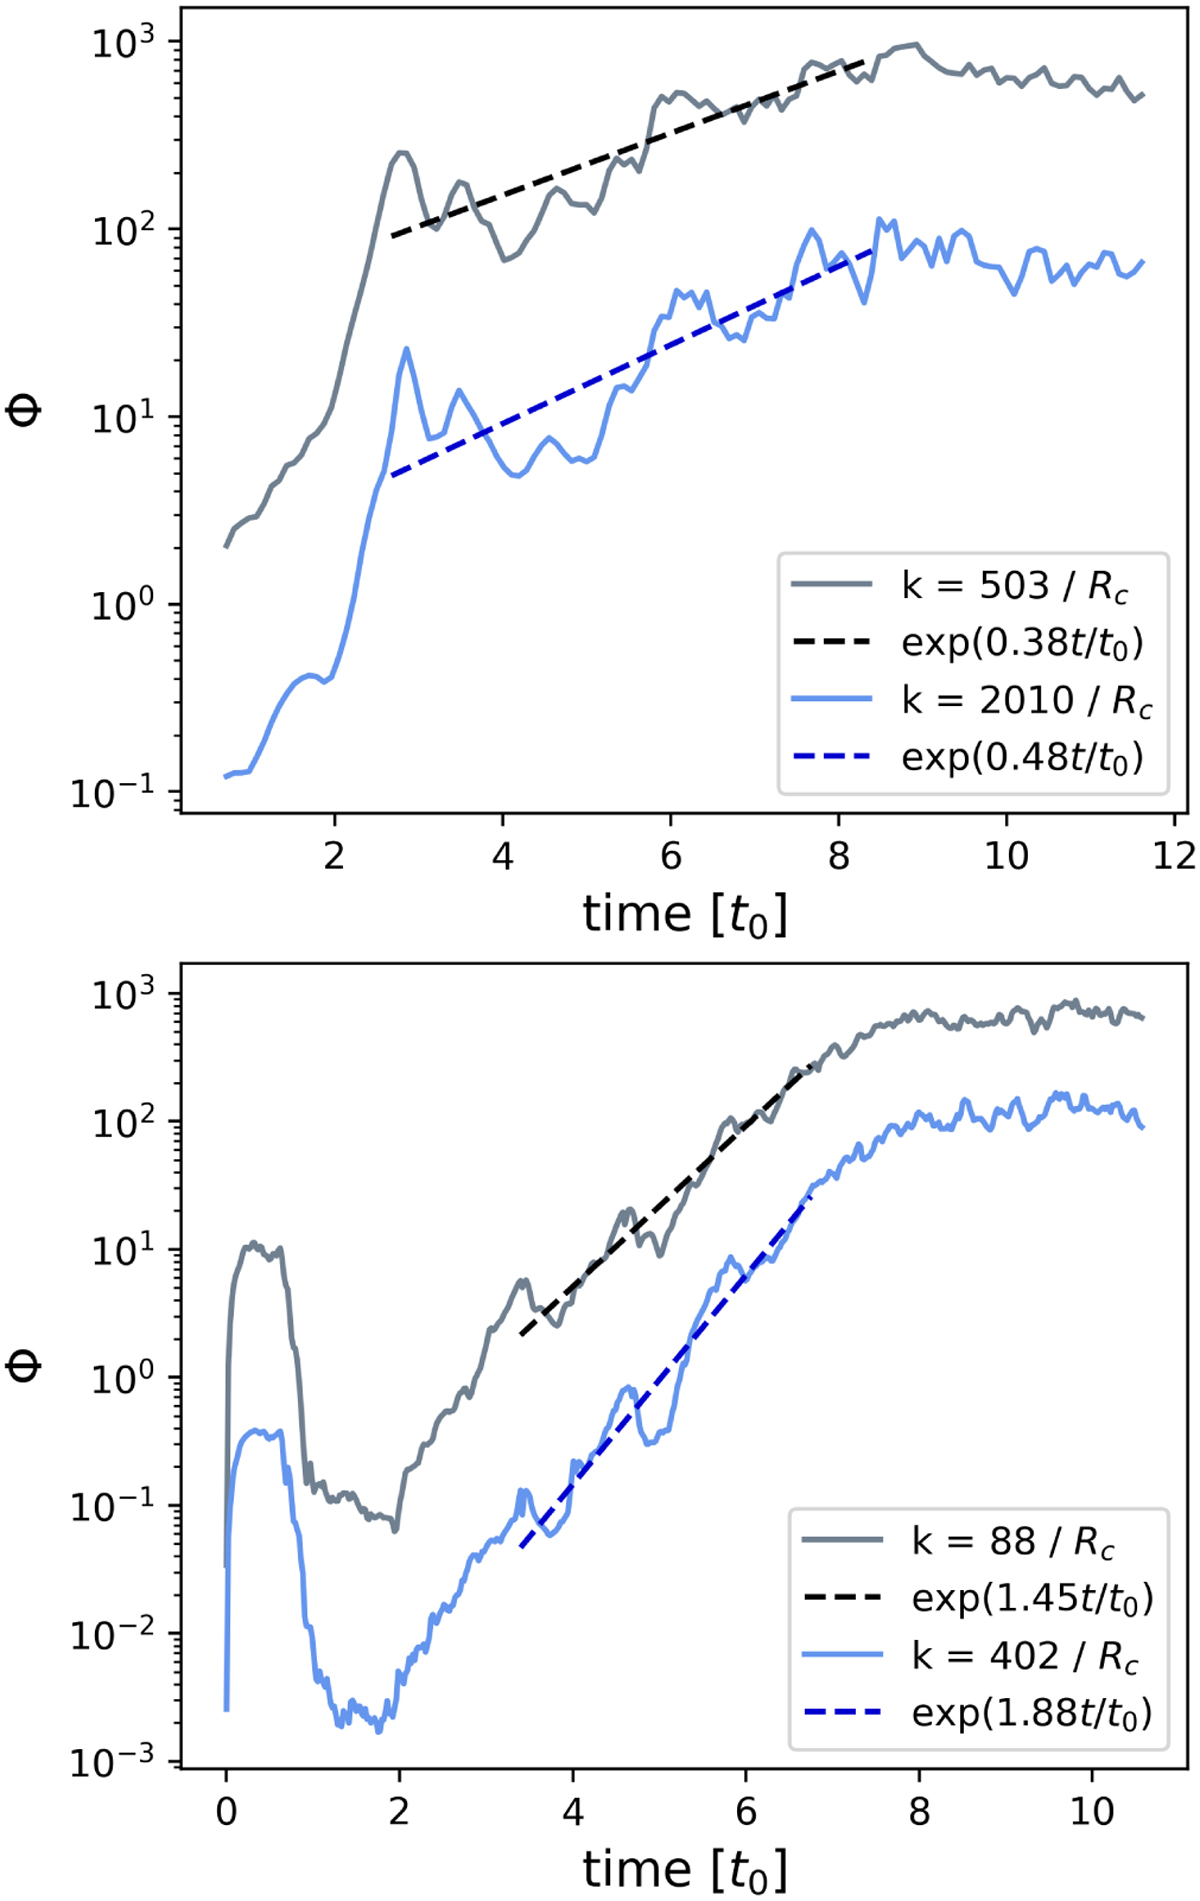
Density power evolution over time of the different wavenumber modes in the O4 model (top) and the WR model (bottom). The blue curves show the evolution of the large-wavenumber mode and the gray curves show the small-wavenumber mode. The dashed curves show the respective exponential fits.
Current usage metrics show cumulative count of Article Views (full-text article views including HTML views, PDF and ePub downloads, according to the available data) and Abstracts Views on Vision4Press platform.
Data correspond to usage on the plateform after 2015. The current usage metrics is available 48-96 hours after online publication and is updated daily on week days.
Initial download of the metrics may take a while.