Fig. 8
Download original image
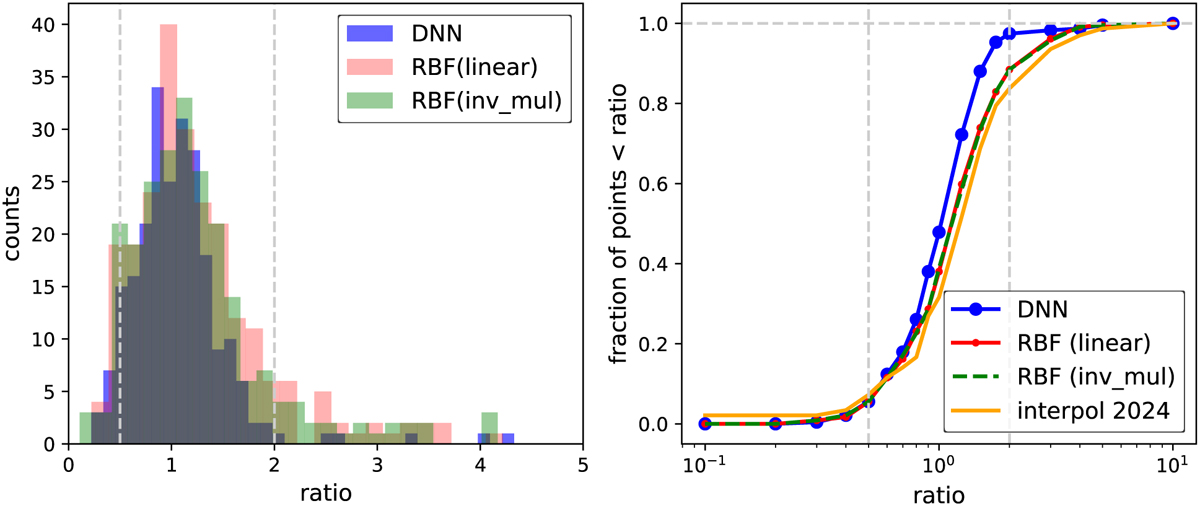
Distribution of the mass-loss rate ratio between interpolated and true values for the test dataset. Left: Ratio between interpolated and true values for the test dataset using the DNN (blue), the RBF with a linear kernel (red), and the RBF with a inverse_multiquadratic kernel (green). For the DNN, ~92% of the points have ratios lying between 0.5 and 2, while for RBF and interpol2024 (not shown for better visualisation) it is ~83% and ~78%, respectively. Right: Cumulative distribution of the fraction of points having the mass-loss rate ratio in the 0.1–10 range. DNN interpolation outperforms the other methods. The RBF interpolation with linear and inverse_multiquadratic (inv_mul) are nearly identical. The choice of shape parameter ϵ and degree of polynomials are different and have been obtained via a grid-based optimisation process, as described in Appendix C.
Current usage metrics show cumulative count of Article Views (full-text article views including HTML views, PDF and ePub downloads, according to the available data) and Abstracts Views on Vision4Press platform.
Data correspond to usage on the plateform after 2015. The current usage metrics is available 48-96 hours after online publication and is updated daily on week days.
Initial download of the metrics may take a while.