Fig. 5
Download original image
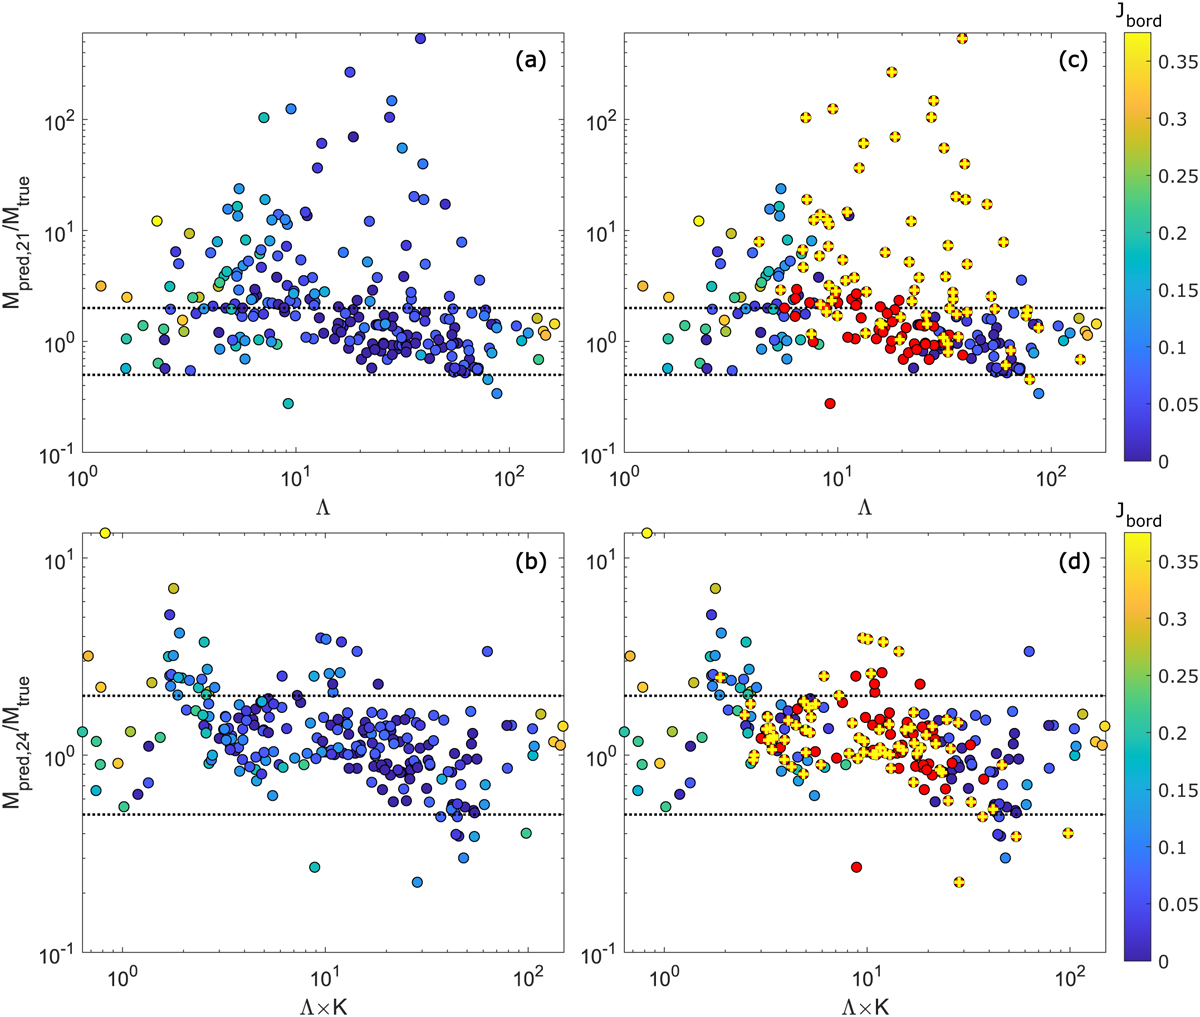
Ratio of the mass-loss rates predicted for the test planets by interpol2021 (panels a and c) and interpol2024 (panels b and d) to the true values given by the hydrodynamic model, against Λ and Λ × K, respectively. The points are colour-coded according to the Jbord value. In panels (c) and (d), the red points have Jtrans = 1, while the red points marked by a yellow plus are those with Jtrans = 2. For reference, the two horizontal black lines in each panel lie at 0.5 and 2.
Current usage metrics show cumulative count of Article Views (full-text article views including HTML views, PDF and ePub downloads, according to the available data) and Abstracts Views on Vision4Press platform.
Data correspond to usage on the plateform after 2015. The current usage metrics is available 48-96 hours after online publication and is updated daily on week days.
Initial download of the metrics may take a while.