Fig. 4

Download original image
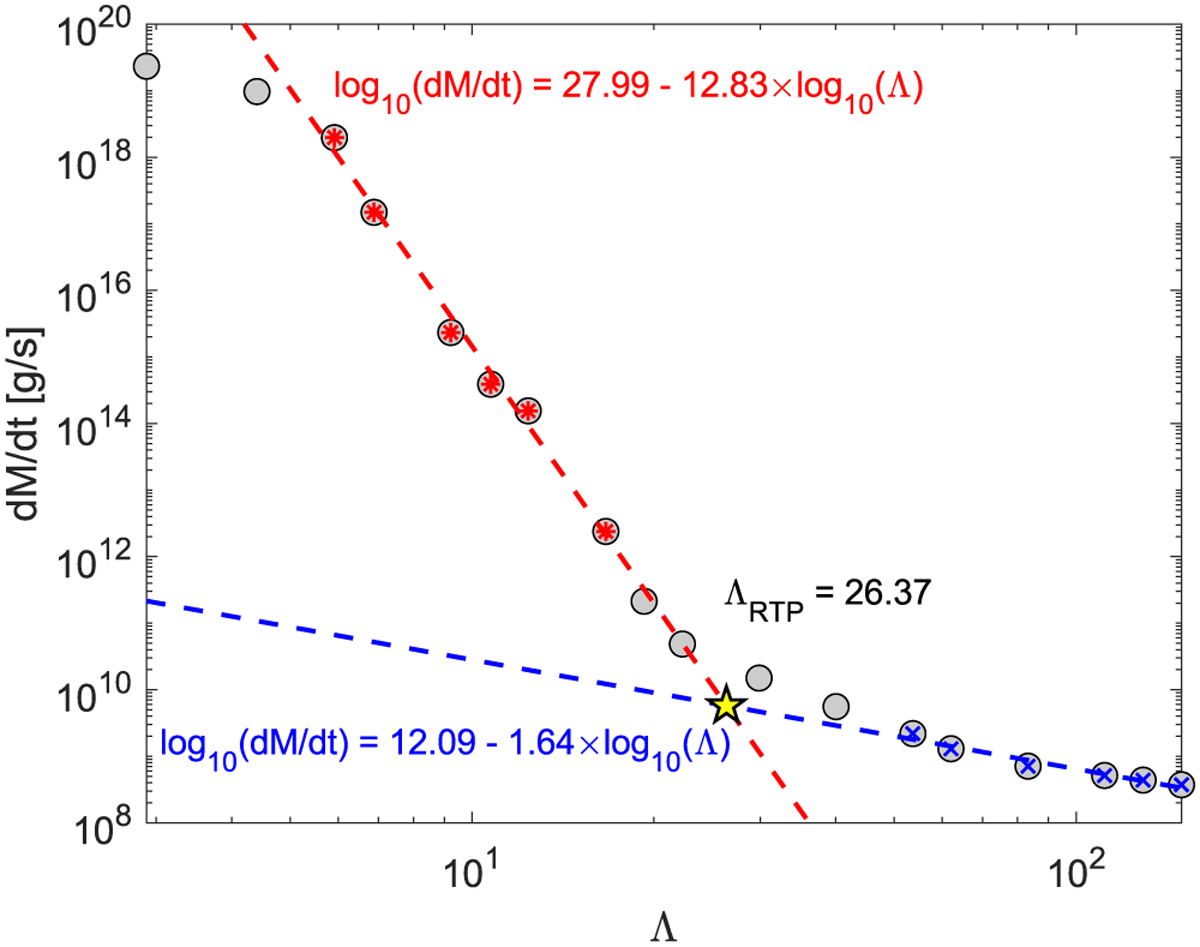
Definition of the location of the regime transition point (ΛRTP) for M* = 0.6 M⊙, Teq = 1100 K, Rpl = 5 R⊕, and FEUV = 543.3 erg s cm−2. Grey circles show the atmospheric mass-loss rates against Λ given by the hydrodynamic model. The red asterisks denote points identified as planets in the core-powered or Roche lobe overflow regime (Ṁ ≥ 1012 g s−1 and Rroche > 1.5; the latter condition excludes points that are too much affected by the lower boundary condition). The blue crosses denote the points in the XUV-driven regime (Ṁ ≤ 109 g s−1). The red and dashed blue lines show the linear fits in the log Ṁ–log Λ space for these two groups of points, as specified in the plot. The yellow star gives the position of the regime transition point.
Current usage metrics show cumulative count of Article Views (full-text article views including HTML views, PDF and ePub downloads, according to the available data) and Abstracts Views on Vision4Press platform.
Data correspond to usage on the plateform after 2015. The current usage metrics is available 48-96 hours after online publication and is updated daily on week days.
Initial download of the metrics may take a while.


