Fig. 11
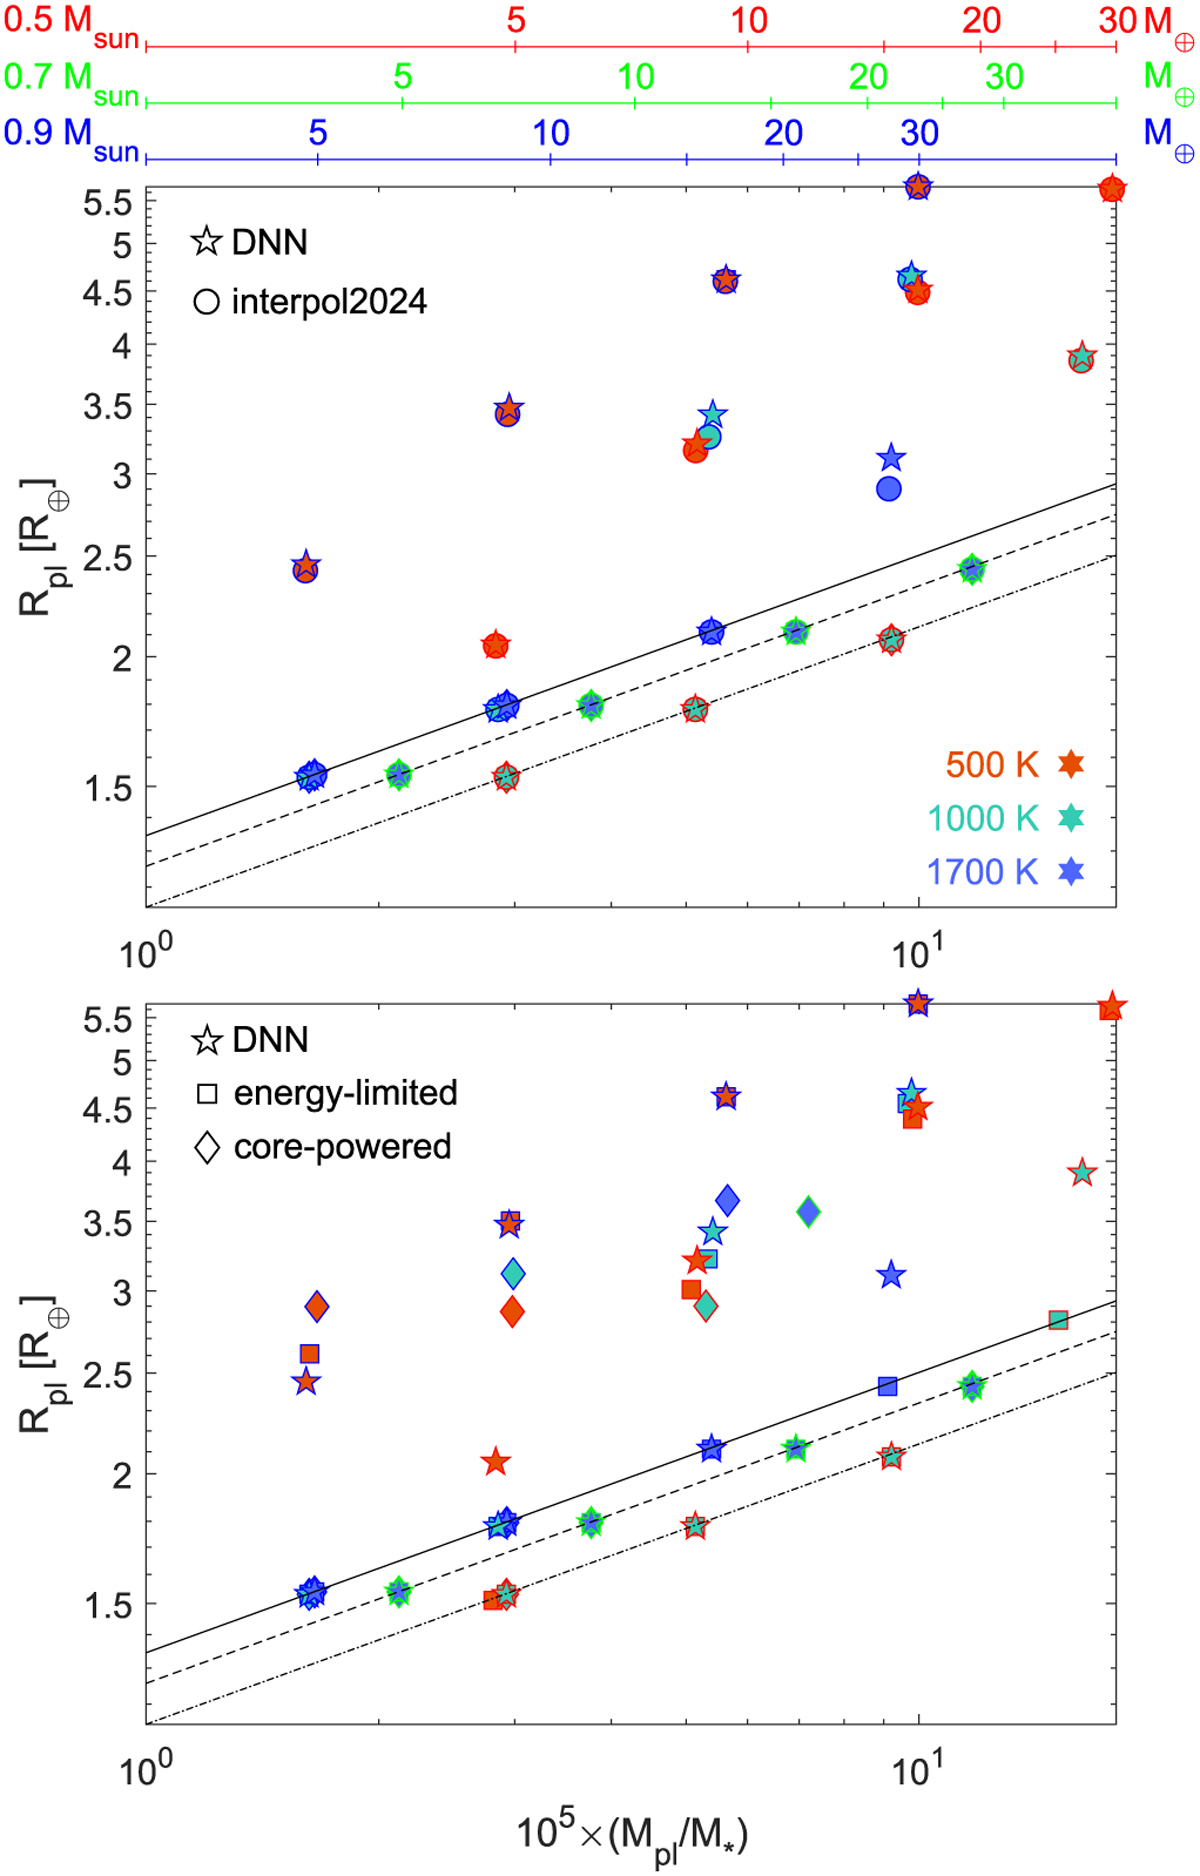
Download original image
Mass–radius distribution at 5 Gyr as predicted by the evolution model for synthetic planets 1–24 employing different atmospheric mass-loss models. Top: comparison of MLink (stars) with interpol2024 (circles). Bottom panel: comparison of MLink with energy-limited approximation (squares) and core-powered mass loss (diamonds). In both panels, the symbol fill colour indicates the equilibrium temperature of the planet (red for 500 K, turquoise for 1000 K, and blue for 1700 K), and the contour line of the symbols indicates the mass of the host star (blue line for 0.9 M⊙, green for 0.7 M⊙, and red for 0.5 M⊙). To ease the comparison, the masses of the planets are normalised to the mass of their host stars, but the three x-axes at the top give the scale in Earth masses for each considered stellar mass. The three black lines, show the radius corresponding to the bare rocky core as a function of the host star mass (solid for 0.9 M⊙, dashed for 0.7 M⊙, and dash-dotted for 0.5 M⊙).
Current usage metrics show cumulative count of Article Views (full-text article views including HTML views, PDF and ePub downloads, according to the available data) and Abstracts Views on Vision4Press platform.
Data correspond to usage on the plateform after 2015. The current usage metrics is available 48-96 hours after online publication and is updated daily on week days.
Initial download of the metrics may take a while.