Fig. 10
Download original image
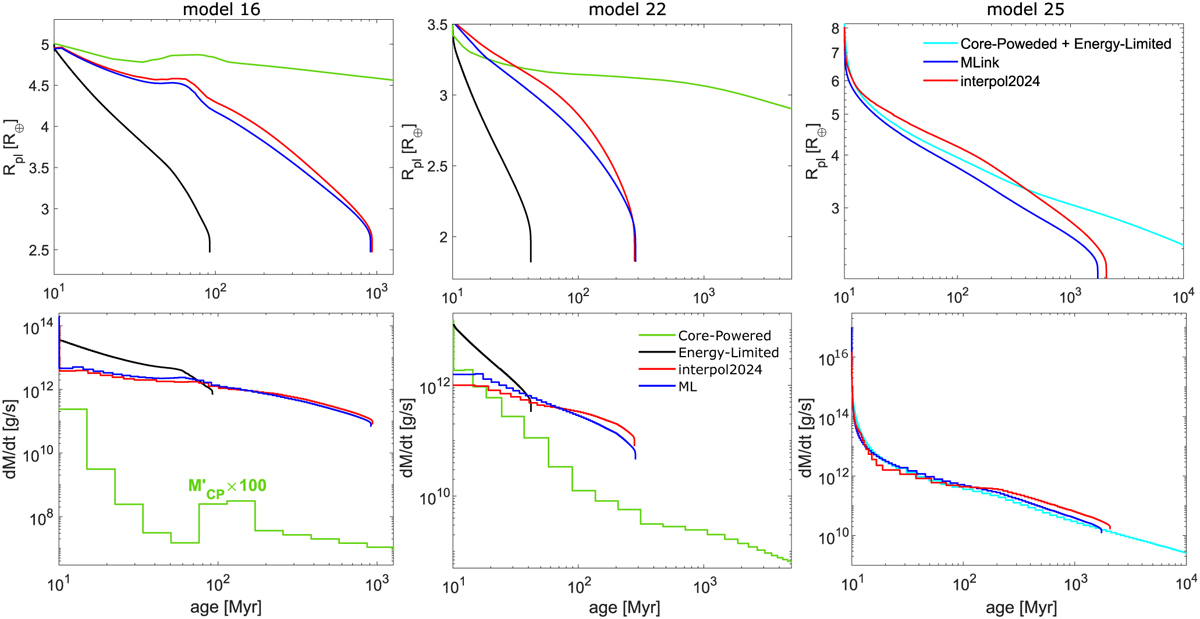
Planetary radius (top) and mass-loss rate (bottom) evolutionary tracks for planets 16 (left; M* =0.7 M⊙; Teq = 1700K; a = 0.0113 AU; ![]() ;
; ![]() ), 22 (center; M* = 0.5 M⊙; Teq = 1000 K; a = 0.0151 AU;
), 22 (center; M* = 0.5 M⊙; Teq = 1000 K; a = 0.0151 AU; ![]() ;
; ![]() ), and 25 (right; ; M* = 0.5 M⊙; Teq = 1000K; a = 0.0151 AU;
), and 25 (right; ; M* = 0.5 M⊙; Teq = 1000K; a = 0.0151 AU; ![]() ;
; ![]() ; see Table 2), as predicted employing MLink (blue lines), interpol2024 (red lines), energy-limited approximation (black lines), and core-powered mass loss (green lines), or the combination of the latter two (cyan).
; see Table 2), as predicted employing MLink (blue lines), interpol2024 (red lines), energy-limited approximation (black lines), and core-powered mass loss (green lines), or the combination of the latter two (cyan).
Current usage metrics show cumulative count of Article Views (full-text article views including HTML views, PDF and ePub downloads, according to the available data) and Abstracts Views on Vision4Press platform.
Data correspond to usage on the plateform after 2015. The current usage metrics is available 48-96 hours after online publication and is updated daily on week days.
Initial download of the metrics may take a while.