| Issue |
A&A
Volume 694, February 2025
|
|
|---|---|---|
| Article Number | A176 | |
| Number of page(s) | 12 | |
| Section | Extragalactic astronomy | |
| DOI | https://doi.org/10.1051/0004-6361/202452366 | |
| Published online | 12 February 2025 | |
Search for the multi-wavelength counterparts to extragalactic unassociated Fermi γ-ray sources
1
INAF, Istituto di Astrofisica Spaziale e Fisica Cosmica, Via U. La Malfa 153, I-90146 Palermo, Italy
2
Università degli Studi di Palermo, Dipartimento di Fisica e Chimica, Via Archirafi 36, I-90123 Palermo, Italy
3
INAF – Osservatorio Astronomico di Brera, Via Bianchi 46, I-23807 Merate, (Lecco), Italy
⋆ Corresponding author; alberto.ulgiati@inaf.it
Received:
25
September
2024
Accepted:
19
December
2024
Aims. We searched for the multi-wavelength (X-ray, optical, and radio) counterparts to the unassociated gamma-ray sources (UGS) of the Fermi 4FGL-DR4 catalogue. The main goal was to identify new blazars and/or new active galactic nuclei that emit at GeV energies [such as (narrow-line) Seyfert-1 and radio galaxies].
Methods. We focused on sky regions that were observed by the Swift satellite and that overlap with the reported positions of the UGSs. Our primary interest are extragalactic sources, and we therefore focused on UGSs that are located outside the Galactic plane (|b|> 10°). Because of the large number of sources (about 1800 UGS), we developed a pipeline to automatise the search for counterparts and significantly reduce the computational time for the analysis. Our association process began by identifying potential X-ray counterparts for each UGS. When one was found, we further searched for corresponding radio and optical counterparts in the X-ray counterpart error box to minimise ambiguities.
Results. Out of the 1284 UGSs in the 4FGL-DR4 catalogue, 714 were observed at least once by Swift/X-ray Telescope (Swift/XRT). We detected at least one X-ray source within the Fermi error box with a significance of ≥3σ for 274 of these γ-ray emitters. Of these, 193 UGSs have a single potential X-ray counterpart (referred to as UGS1), while 81 have multiple potential X-ray counterparts within the Fermi error box (referred to as UGS2). Of the UGS2, 54 have two X-ray counterparts, 11 have three, and the remaining 16 have more than three counterparts. Each UGS1 has an optical counterpart, and 113 might also be associated with a radio counterpart. We compared the properties of the possible counterpart with those of the γ-ray emitters identified by Fermi with the aim to assess the goodness of our associations.
Key words: galaxies: active / BL Lacertae objects: general / quasars: supermassive black holes / gamma rays: galaxies / radio lines: galaxies / X-rays: galaxies
© The Authors 2025
 Open Access article, published by EDP Sciences, under the terms of the Creative Commons Attribution License (https://creativecommons.org/licenses/by/4.0), which permits unrestricted use, distribution, and reproduction in any medium, provided the original work is properly cited.
This article is published in open access under the Subscribe to Open model. Subscribe to A&A to support open access publication.
1. Introduction
Fifteen years have elapsed since the launch of the Fermi satellite. This space observatory was designed for studying celestial objects that emit in the γ-ray energy range. With a field of view of 2.4 sr, Fermi performs an all-sky survey every three hours and is an exceptionally powerful tool for studying γ-ray sources in the 100 MeV−300 GeV energy range (for details see Atwood et al. 2009).
In 2023, the Fermi collaboration released the incremental version of the fourth catalog (4FGL-DR4, Abdollahi et al. 2020; Ballet et al. 2023), which reports the sources detected during the 14 years of observations by the Large Area Telescope (LAT) detector. Of the total 7195 objects in the catalogue, 4765 have been associated or identified at other wavelengths through either a positional overlap in the sky, measurements of correlated variability, and/or multi-wavelength spectral properties (Abdollahi et al. 2020; Ballet et al. 2023). The catalogue includes Galactic and extragalactic sources, the latter of which dominate the γ-ray sky. Active galactic nuclei (AGN) are galaxies with a super-massive black hole that accretes matter from the surrounding galactic regions. They are the key component of these extragalactic sources. Blazars represent the most numerous population of AGN, and 3934 objects are identified in the catalogue. Blazars are distinguished by their jets, which are oriented at a small angle (θ < 10°) relative to the line of sight of the observer (e.g. Urry & Padovani 1995; Giommi et al. 2013; Costamante 2020). Other classes of AGN, such as radio and Seyfert galaxies, constitute only a small fraction (approximately 1%) of the catalogue (e.g. Cheung & Fermi LAT Collaboration 2010; Abdo et al. 2010; Ackermann et al. 2011; Grandi 2012; Paliya et al. 2015; Angioni et al. 2017; Rieger 2017; Järvelä et al. 2021; Ye et al. 2023; Ballet et al. 2023).
This geometrical configuration means that the observed blazar emission is dominated by the relativistic jet, whose emission spans from the radio band up to very high energy (VHE; E > 100 GeV) γ-rays. The spectral energy distribution (SED) exhibits a double-bump shape: The first bump extends from the submillimeter to the X-ray energy band and is interpreted as synchrotron emission from a population of relativistic electrons in the jet, and the second bump dominates the emission in the MeV–TeV range, but its origin still remains a matter of debate. The two main scenarios that were invoked to explain this second high-energy peak involve either hadronic or leptonic processes. In the leptonic scenario, the second peak is attributed to inverse-Compton scattering, where the same population of relativistic electrons that produces the synchrotron emission upscatters low-energy photons from the jet itself and/or from external regions (the disc, torus, or broad-line region) to higher energies (Costamante et al. 2018). Conversely, in the hadronic scenario, the high-energy emission is due to interactions involving relativistic protons, such as proton-synchrotron radiation or photo-pion production, followed by cascading processes that produce γ-rays (e.g. Cerruti et al. 2015; Rodrigues et al. 2019; Gao et al. 2019; Cerruti 2020). The blazar population is categorised into two main classes based on the properties of their optical spectra: Flat-spectrum radio quasars (FSRQs), which are characterised by prominent emission lines that are traditionally defined as having an equivalent width, EW > 5 Å (Stickel et al. 1991; Stocke et al. 1991; Falomo et al. 2014), and BL Lacertae objects (BL Lacs, or BLL), with weak or no emission lines (EW < 5 Å).
However, the Fermi catalogue includes a substantial population (about 30% of the sources) that remains unclassified and so far lacks an association with any lower-energy counterparts. This population is hereafter referred to as unassociated gamma-ray sources (UGSs). UGSs represent a significant component of the high-energy sky and might hide new blazars and/or new AGN of different classes. Moreover, since they are faint objects (UGSs have lower γ-ray fluxes on average, ∼5.3 × 10⁻¹² erg cm−2 s−1, with respect to associated AGN sources, ∼1.6 × 10⁻¹¹ erg cm−2 s−1, in the 100 MeV to 100 GeV range), they may represent a higher-redshift AGN population and/or lower-luminosity sources. Therefore, investigating them is key to population studies, the development of physical models, and the interpretation of the cosmic evolution of the γ-ray sources (Ajello et al. 2014; Ghisellini et al. 2017). In addition, it is crucial to identify the UGSs to estimate the VHE cosmic background (di Mauro 2018; Acciari et al. 2019; Ballet et al. 2023).
The main difficulty for selecting UGS counterparts are the large Fermi positional errors that arise from limited photon statistics and the angular resolution of the LAT detector (68% containment radius: 3.5° at 100 MeV, 0.6° at 1 GeV, and > 0.15° at > 10 GeV). This results in tens to hundreds of potential low-energy (optical and radio bands) counterparts within the typical Fermi error boxes. The number of candidates is severely affected by several factors such as the energy band, the detector sensitivity, and the sky region. It can therefore be very challenging to attribute the γ-ray emission to a specific source among these candidates. Several efforts have been made over the years in order to associate and classify UGSs. Various statistical algorithms (Ackermann et al. 2012; Mirabal et al. 2012; Mao & Yu 2013) and neural network classifiers (Doert & Errando 2014; Salvetti et al. 2017a; Kaur et al. 2019a,b, 2023; Kerby et al. 2021) based on γ-ray spectral features and variability information were developed with the aim to distinguish blazars from other γ-ray source populations. Other works were focused on the search for counterparts at other wavelengths. In the radio band, Petrov et al. (2013), Nori et al. (2014), Schinzel et al. (2015, 2017), and Bruzewski et al. (2021, 2022) provided radio counterparts of UGSs using ATCA (Australia Telescope Compact Array) and LOFAR (LOw-Frequency ARray Two-metre Sky Survey, Shimwell et al. 2022) data. D’Abrusco et al. (2013) and Massaro et al. (2015, and references therein) proposed AGN candidates on the basis of the colours of the infrared (IR) counterparts in the Wide-field Infrared Survey Explorer (WISE) survey (Wright et al. 2010). Searches using X-ray data were performed by Falcone et al. (2011), Takahashi et al. (2012), Landi et al. (2015), Salvetti et al. (2017b), Kaur et al. (2019a,b, 2023), Kerby et al. (2021), and Marchesini et al. (2020), while a multi-wavelength approach was adopted by Acero et al. (2013), Paiano et al. (2017a), Fronte et al. (2023). Moreover, numerous pulsars were discovered among the UGSs through timing studies from the γ-ray to the radio band (Abdo et al. 2013; Wu 2018; Li et al. 2018, and references therein).
The firm classification of extragalactic UGSs is based on studying the optical spectra of their lower-energy counterparts. Optical spectra act as the fingerprints of these objects and enable determining their extragalactic nature and classification. Shaw et al. (2012, 2013) studied the optical spectra of about 500 sources of the second Fermi catalogue (2FGL, Nolan et al. 2012). They confirmed the BLL nature of these objects and estimated a redshift (or a lower limit) for each of them. D’Abrusco et al. (2013) and Massaro et al. (2015, 2016) and references therein focused on the association and classification of the UGSs of the second and third Fermi (3FGL, Acero et al. 2015) catalogues. In a sample of ∼600 candidates, they classified ∼200 blazars using selection criteria based on the infrared (IR) colours of counterparts in the WISE survey. Paiano et al. (2017b,c, 2020, 2021, 2023) analysed the optical spectra of ∼150 BLL objects (or candidates) identified as TeV (or TeV candidate) emitters and/or potential neutrino sources. In addition, Paiano et al. (2017d, 2019) and Ulgiati et al. (2024) focused on the association and classification of UGSs from the second, third, and forth Fermi (4FGL, 4FGL-DR3, 4FGL-DR4; Abdollahi et al. 2020, 2022; Ballet et al. 2023) catalogues. This resulted in the classification of ∼80 new AGN (∼80% of which were blazars and ∼20% were AGN of other types).
We analyse UGSs from the 4FGL-DR4 catalogue that are located outside of the Galactic plane (|b|> 10°) and that were also observed by the Neil Gehrels Swift Observatory (Gehrels et al. 2004). The choice to exclude sources in the region of the Galactic plane was motivated by our primary interest in AGN, as sources at high Galactic latitudes are more likely to be extragalactic. For more than 10 years, the Swift satellite has been involved in a campaign dedicated to observing UGSs (Stroh & Falcone 2013; Falcone et al. 2014), and all data are available in the public archive1. The aim of this paper is to find X-ray counterparts of a sample of UGSs. This allowed us to reduce the degeneracy in the determination of the optical counterpart because the number of X-ray sources in the typical Fermi error boxes (the average 99.7% containment radius is ∼6 arcmin, estimated over the entire range of LAT) is much smaller than in the optical band or even at lower energies. Furthermore, it also narrows down the search region for identifying potential radio and optical counterparts because the angular resolution of the Swift/X-ray Telescope (Swift/XRT) detector is a few arcseconds. Our search for UGS counterparts is based on the analysis of all XRT images that cover the UGS sky regions.
The paper is structured as follows: Section 2 outlines the X-ray data reduction and analysis, automated through the use of a pipeline developed by our group. In Sect. 3 we describe the search for the multi-wavelength counterparts, and we discuss the results in Sect. 4. Sect. 5 contains the discussion, and Sect. 6 contains the conclusions.
2. X-ray detection pipeline, data reduction, and analysis
The 4FGL-DR4 catalogue contains 2430 UGSs, 1284 of which are located outside of the Galactic plane region. At least one Swift/XRT observation covers 714 of these 1284 sources.
Because of the large number of UGSs with available X-ray data, we developed a pipeline to reduce and automatise the data reduction and analysis process. The pipeline is based on Python and performs source detection and spectral analysis of all the available XRT observations that overlap with the UGS positions. The HeaSoft FTOOLS version 6.30.1 (NASA High Energy Astrophysics Science Archive Research Center 2014) package was used for the analysis. With the data-reduction tool provided by the UK Swift Science Data Centre2 (Evans et al. 2020), the pipeline took the UGS position for each UGS and performed the following routine:
-
It searched for all the available Swift/XRT observations that cover the UGS positions within a cone search radius of 20 arcmin.
-
It created a 0.3−10 keV Swift/XRT stacked image.
-
It ran a source-detection algorithm (with an initial cutoff at 1.5σ significance).
-
It determined the position (with the associated uncertainty) of any detected X-ray source within the Swift/XRT field of view (23.6′ × 23.6′) around the position of the γ-ray emitter. If data acquired with the UV and Optical Telescope (UVOT) on board of Swift were available, it provided the enhanced source position corrected for astrometry (Goad et al. 2007).
-
It generated a list of X-ray detections (to which an ID was assigned), listed the position and the signal-to-noise ratio (S/N) for each X-ray detected source.
-
It selected detected sources that lay within the 3σFermi error region of UGS sources with an S/N ≥ 33.
-
For each of the selected X-ray detections, an average spectrum was produced. Circular (annular) extraction regions were used to extract the source (background) events, as described in Evans et al. (2009).
-
Each spectrum was grouped with the HeaSoft FTOOLS tool GRPPHA in order to accumulate at least 8 counts per energy bin. This choice was a compromise to maximise the degrees of freedom of the fit and the significance of the points because only a small number of counts was collected for each X-ray source (the median value was ∼40 photons). Additionally, this grouping allowed us to use χ2 statistics for the analysis for most of the analysed spectra4.
-
Finally, the 0.3−10 keV X-ray spectral analysis was performed using XSPEC version 12.12.1 (Arnaud 1996, 2022).
Since blazars are the dominant population in the 4FGL-DR4 catalogue and are characterised by a non-thermal X-ray emission, we modelled the spectra of each detected X-ray source with an absorbed power law. In particular, we fitted the data with the model TBABS*POWERLAW in XSPEC, where TBABS describes the column density (nH) of the interstellar and intergalactic absorption, and we adopted the abundance set from Wilms et al. (2000). Because only a few counts were detected per source, the nH parameter was fixed to the Galactic line-of-sight value. Furthermore, in order to roughly estimate the source flux, the power-law photon index was fixed to 2 for spectra with no more than two or three spectral points. The photon index of 2 was determined as a reasonable average of the typical blazar slope (e.g., Padovani et al. 2017).
3. Search for multi-wavelength counterparts
Taking the position of X-ray sources found within the UGS error ellipses, we searched for their possible radio and optical counterparts. To do this, we took the ∼99% confidence level error boxes on the X-ray positions (which is ∼4 arcsec on average).
In the optical, we searched for counterparts using the Sloan Digital Sky Survey (SDSS, Ahumada et al. 2020), the Panoramic Survey Telescope and Rapid Response System (PanSTARRS, Chambers et al. 2016) database, the Dark Energy Survey (DES, Abbott et al. 2021), and the SuperCOSMOS Sky Survey (SSS, Hambly et al. 2004). After we identified possible optical counterparts, we searched the Gaia Early Data Release 3 (EDR3; Seabroke et al. 2021) archive to determine which sources had measured proper motions. The significance of the proper motion was calculated as the ratio of the proper motion and its uncertainty.
Two catalogues were used to search for possible radio counterparts: the Very Large Array Sky Survey (VLASS; Lacy et al. 2020), and the Rapid ASKAP Continuum Survey (RACS; Hale et al. 2021). When a radio counterpart was not significantly detected, and thus not reported in the radio catalogues, but was within the survey region, we set an upper-limit flux using the sensitivity threshold of the RACS survey (1.5 mJy at 5σ) for the sources located at −90° < δ < −40° and of VLASS survey (0.345 mJy at 5σ) for the objects at −40° < δ < +90°.
In addition, we also conducted dedicated follow-up radio observations using the ATCA for a sample of 18 UGSs (see Table A.1 in the appendices; see Zenodo). These 18 sources were selected either because the survey images showed a potential but not highly significant radio counterpart [a 2σ ≤ S/N ≤ 4σ detection from the analysis of the RACS and LOFAR images] because their sky position was not covered by radio, or because the survey images showed intriguing extended radio structures. The data reduction and main results of this campaign are described in Appendix A (https://zenodo.org/records/14543340).
4. Results
Two hundred and seventy-four of the 714 UGSs with a Swift/XRT observation have at least one X-ray detection with an S/N ≥ 3 inside the Fermi error box. Only one possible counterpart in the Fermi error box was found for 193 of these (hereafter UGS1; see an example of a UGS1 source in the top panel of Fig. 1; the entire UGS1 sub-sample is shown in the appendices; see Zenodo), while 81 have more than one potential X-ray counterpart (hereafter UGS2; see an example of a UGS2 source in the bottom panel of Fig. 1). The details about the Swift/XRT observations and all X-ray detections related to UGS1 and UGS2 are listed in Tables 1 and 2, respectively. For each X-ray detection, we performed an analysis of the X-ray spectral data (see Sect. 5), we list in Tables 3 and 4 the results of the XRT spectral fitting for UGS1 and UGS2. The spectral analysis allowed us to estimate the source-absorbed flux and to give a first rough indication of the spectral slope.
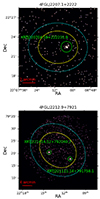 |
Fig. 1. X-ray sky map of 4FGL J2207.1+2222 (upper panel) and 4FGL J2212.9+7921 (bottom panel). The yellow and cyan ellipses indicate the 2σ and 3σFermiγ-ray error regions, respectively. The X-ray detection is shown with a green circular region. |
Swift/XRT detections within the 3σFermi error boxes of UGS1.
Swift/XRT detections within the 3σFermi error boxes of UGS2.
Results of the X-ray spectral fitting for the UGS1 subsample.
Results of the X-ray spectral fitting for the UGS2 subsample.
Of a total of 431 possible X-ray counterparts, 384 sources can be well fit with a simple absorbed power law (0.8 ≤  ≤ 1.2). The fitting statistics for the other 36 sources are very poor (fewer than three spectral points), and we therefore only roughly estimated the absorbed flux by fixing the nH and the power-law index of the spectral model. The spectral fits for the remaining 11 X-ray sources are unreliable (
 ≫ 1.2 or
  ≪ 0.8).
Comparing the distribution of absorbed 0.3−10 keV fluxes for UGS1 and UGS2 (see Fig. 2, which excludes sources that exhibit proper motion according to Gaia and are therefore likely to be Galactic objects), we find that the UGS1 flux distribution follows a log-normal behaviour, but the UGS2 distribution is less predictable, probably due to the dominance of spurious sources. The χν2 from fitting the X-ray fluxes of UGS2 with a log-normal function indicated that the model does not fit the data well. To avoid underestimating the uncertainties, we introduced a systematic error into the data for the UGS2 and repeated the fit. The best-fitting results are reported in Table 7.
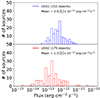 |
Fig. 2. Absorbed 0.3−10 keV flux distributions for UGS1 and UGS2. Sources with proper motion are excluded from the histograms. |
Using the position of each X-ray detection, we list the potential optical and radio counterparts for UGS1 and UGS2 in Tables 5 and 6. The table provides the optical coordinates, the magnitude in the g and r bands, and the optical and radio flux. Finally, we report the radio-loudness parameter R, which is defined as the ratio of the radio density flux, in the 2−4 GHz range, and the optical g-band density flux. Historically, sources with R > 10 are defined as radio-loud sources, otherwise, they are are radio quiet (Kellermann et al. 1989).
MWL counterparts of UGS1.
MWL counterparts of UGS2.
For the total of 431 X-ray counterparts (193 for UGS1 and 238 for UGS2), we find that the Gaia survey reports a significant (> 3σ) proper motion for 41 and 63 optical counterparts of UGS1 and UGS2, respectively. This strongly supports a possible Galactic origin.
4.1. UGS1 counterparts
All of 193 UGS1 X-ray counterparts are coincident with optical sources (see an example in Fig. 3 and the entire sample in Fig. C.2, (https://zenodo.org/records/14543340)) whose g magnitudes span from 6.3 to 24.9 (from 14.9 to 24.9 when sources with proper motion are excluded), while their r magnitudes span from 6.7 to 24.9 (from 13.4 to 24.7 when sources with proper motion are excluded). The distribution of magnitudes in the g and r bands are shown in Fig. 4.
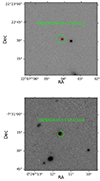 |
Fig. 3. Optical r-band PanSTARRs image of the 4FGL J2207.1+2222 counterpart (upper panel) and the 4FGL J0026.1−0732 counterpart (bottom panel). The green circle represents the error box of the X-ray counterpart, and the red ellipses show the error box of radio counterparts found within the VLASS catalogue. |
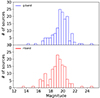 |
Fig. 4. Distribution of magnitudes in the g (top) and r band (bottom) for UGS1. Sources with proper motion have been excluded from the histogram. |
Furthermore, 113 X-ray counterparts of the 193 UGS1 are also coincident with a radio source (105 when sources with proper motion are excluded). 33 UGS1 optical counterparts already have optical spectra in the literature, which were presented in Ulgiati et al. (2024).
All X-ray sources coincident with a radio source from the VLASS and RACS catalogues and for which we have an estimate of the optical magnitude in the g band are radio loud, except for 4FGL J0641.4+3349/PAN J064111.22+334459.7 with R = 2. This source is classified as a low-redshift QSO on the basis of the absolute magnitude and the emission lines detected in the optical spectrum (Monroe et al. 2016; Ulgiati et al. 2024).
All the sources observed in the radio band using ATCA are radio quiet, except for five objects: 4FGL J0126.3−6746/SSS J012622.15−674623.0 (R = 1601) and 4FGL J1709.4−2127/PAN J170936.70−212838.9 (R = 90)5, 4FGL J0536.1−1205/PAN J053626.80−120652.1 (already listed in the VLASS catalogue, R = 216), 4FGL J0755.9−0515/PAN J075614.43−051718.9 (R = 16), and 4FGL J1415.9−1504/PAN J141546.17−150229.0 (R = 13).
The other UGS1 X-ray sources that do not coincide with a radio source can be considered radio quiet, although for 30 of them, the radio and R upper limit are poorly constrained (R > 10). For a comparison between the distribution of the R value in the UGS1 sub-sample and in Fermi blazars, we refer to Fig. 5.
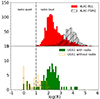 |
Fig. 5. Distribution of the radio-loudness parameter (log(R)) value for 1409 objects classified as BLL and 771 objects as FSRQ of the 4LAC catalogue (upper panel) and for the counterparts of UGS1 (lower panel). The empty orange bars represent the upper limits on R for UGS1 without a radio counterpart. The dashed vertical black line represents the radio-loudness parameter value (R = 10) that separates the radio-quiet from the radio-loud sources. Sources with proper motion are excluded from the histograms. |
4.2. UGS2 counterparts
Fifty-four sources of the UGS2 sample are associated with 2 potential X-ray counterparts, and the two counterparts of 7 of these exhibit proper motion, and 18 have only one counterpart with proper motion. Only 8 of the latter 18 UGSs have at least one non-moving object coincident with a radio source. Additionally, 11 UGS2 objects have three potential X-ray counterparts, and 16 have more than three X-ray counterparts. Similar to our approach with UGS1 sources, all potential X-ray counterparts of UGS2 that coincide with a radio source catalogued in VLASS or RACS for which we have an estimate of the optical magnitude in the g band are found to be radio loud, except for three, 4FGL J0159.0+3313/XRT J015905.35+331257.8, 4FGL J1008.2−1000/XRT J100848.62−095450.2, and 4FGL J1407.7−3017/XRT J140806.82−302353.7, which are radio quiet. Investigating the optical images and the literature for these objects, we found that XRT J015905.35+331257.8 is located very close to a star (∼25 arcsec), which probably compromises the measurement of the optical magnitude; XRT J100848.62−095450.2 is a Seyfert 1 (Véron-Cetty & Véron 2006) with a redshift of z = 0.057253 (Jones et al. 2009); and XRT J140806.82−302353.7 is a Seyfert 1 (Malizia et al. 2012) with redshift z = 0.023456 (Jones et al. 2009). The other UGS2 objects that do not coincide with a radio object are either radio quiet or have an upper limit for R that exceeds the threshold of 10.
5. Discussion
We compared the main flux properties of the UGS X-ray counterparts with the main class of extragalactic γ-ray emitters detected by Fermi to characterise the nature of UGS counterparts and to test the goodness of our proposal. In particular, we compared the X-ray 0.3−10 keV flux distribution of UGS1 with those of the 4FGL-DR4 blazars (see Fig. 6), where we excluded blazar candidates of uncertain type (BCU), since they could hide objects that are misclassified as blazars. As seen before, we adopted a log-normal function to describe the flux properties. However, we found that the flux distribution of 4FGL-DR4 BLL cannot be described by a log-normal distribution (χν2 ≫ 1 and p-value ≪ 0.05)6. The results of the fit are reported in Table 7.
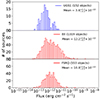 |
Fig. 6. Absorbed 0.3−10 keV flux distributions for UGS1 (top), 4FGL-DR4 BLL (centre) and 4FGL-DR4 FSRQ (bottom). Sources with proper motion are excluded from the histograms. |
Results of fits on X-ray flux distributions.
We note that the X-ray fluxes of UGS1 are generally lower than those of the 4FGL-DR4 blazars (expected values of the distributions in Table 7). A simple explanation for this behaviour is linked to the fact that UGSs are intrinsically weak γ-ray emitters, revealed by the ever-increasing exposure time (and hence the statistics) of the Fermi survey, which allows the detection of the sources with weakest fluxes. These probably belong to the blazar population at large distances and/or may be AGN with a low nucleus-to-host flux ratio.
We further built the colour-colour diagrams considering the ratios of the absorbed fluxes at different energy bands, in particular, log(Fradio/FX) and log(Foptical/FX) as a function of log(Fγ/FX) for UGS1 (see Fig. 7) and UGS2 (see Fig. 8). In the same plots, we also included the 4FGL-DR4 blazars and 4FGL-DR4 Galactic sources (pulsars, pulsar wind nebulae, high-mass X-ray binaries, low-mass X-ray binaries, and supernova remnants). For the 4FGL-DR4 sources that are not covered by Swift/XRT observations, we extracted their X-ray fluxes from the 4XMM-DR13 catalogue (Webb et al. 2020) in order to increase the number of sources with an estimated X-ray flux.
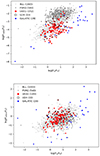 |
Fig. 7. log(Fradio/FX) vs log(Fγ/FX) (top) and log(Foptical/FX) vs log(Fγ/FX) (bottom) diagrams and for 4FGL-DR4 BLL (light grey), 4FGL-DR4 FSRQ (grey), UGS1 (red), and 4FGL-DR4 Galactic sources (blue). The sources that were analysed in Ulgiati et al. (2024) are underlined with a black edge around the points. Sources with proper motion or without g-band magnitude estimates are not included in the plot. |
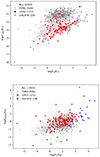 |
Fig. 8. log(Fradio/FX) vs log(Fγ/FX) (top) and log(Foptical/FX) vs log(Fγ/FX) (bottom) diagrams and for 4FGL-DR4 BLL (light grey), 4FGL-DR4 FSRQ (grey), UGS2 (red), and 4FGL-DR4 Galactic sources (blue). Sources with proper motion, without an optical counterpart, or without g-band magnitude estimates are not included in the plot. |
All Fermi AGN (∼98% are blazars and hence are radio loud) occupy a compact region in the two colour-colour diagrams, and it is possible to recognize two subregions: one that is populated by BLLs, and another that is populated by FSRQs.
The upper panel of Fig. 7 shows that a fraction of UGS1 (filled red points) occupies the same region as the 4FGL-DR4 blazars (grey points). These are the sources that are detected in the radio and that are radio loud. This supports the classification with the class of radio-loud AGN, and it was confirmed spectroscopically for 19 objects (Ulgiati et al. 2024).
The remaining UGS1 without a radio signal for which a radio flux upper limit is provided are marked as filled red triangles. These sources, along with the UGS1 for which a potential radio counterpart was found using ATCA, considered as radio-quiet objects, are located at the lower edge of the locus occupied by the Fermi blazars. On the other hand, taking into account the second diagram displayed in the bottom panel of Fig. 7, where the radio flux is not taken into account, these sources share the same region as is occupied by AGN, suggesting a radio-quiet AGN nature. Ten of these sources were studied in Ulgiati et al. (2024), and they indeed belong to the class of the Seyfert/QSO on the basis of their optical spectrum. The same analysis was performed for the UGS2 sample (see Fig. 8), where the degree of degeneracy of the number of proposed counterparts leads to more speculative conclusions. The same trend as was found for the UGS1 for which the radio-loud sources occupy the same region as 4FGL-DR4 blazars was found here, while the radio-quiet ones are located in a distinct region.
A detailed analysis of the radio-loud UGS, which are more likely to be blazars, was performed using the diagnostic diagram known as the WISE gamma-ray blazar strip (Massaro et al. 2016, and references therein). In this region in the IR colour-colour space, gamma-ray-emitting blazars are typically located. The distributions of the radio-loud counterparts from UGS1 and UGS2 are shown in Figs. 9 and 10, respectively. The overlap of the radio-loud UGSs with the WISE blazar strip further supports the hypothesis that these sources are likely blazar candidates. However, a definitive confirmation will require optical spectroscopy. We highlight that dedicated spectroscopic campaigns have partly been undertaken and are still ongoing, employing 10-meter-class telescopes (Paiano et al., in prep.). These efforts aim to obtain high-quality optical spectra to characterise their properties and confirm their nature. In addition, multi-wavelength investigations will focus on building the UGS SED to better understand their emission mechanisms. These studies will offer insights into the physical processes powering these objects and will allow us to distinguish between various classes of γ-ray emitters. This is an important step toward a more complete characterisation of the UGS population.
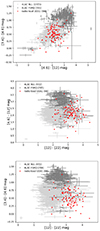 |
Fig. 9. [3.4]–[4.6]–[12] μm (top), [4.6]–[12]–[22] μm (centre) and [3.4]–[4.6]–[12]–[22] μm (bottom) IR colour diagrams for 4FGL-DR4 BLL (light grey), 4FGL-DR4 FSRQ (grey), and radio-loud UGS1 (red). Sources with proper motion are excluded from the histograms. |
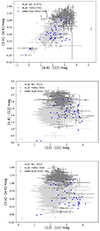 |
Fig. 10. [3.4]–[4.6]–[12] μm (top), [4.6]–[12]–[22] μm (centre) and [3.4]–[4.6]–[12]–[22] μm (bottom) IR colour diagrams for 4FGL-DR4 BLL (light grey), 4FGL-DR4 FSRQ (grey), and radio-loud UGS2 (blue). Sources with proper motion are excluded from the histograms. |
6. Conclusions
The primary aim of this work was to create a catalogue of possible counterparts and list their multi-wavelength emission fluxes. Detailed studies of individual sources are ongoing: Optical spectroscopic campaigns are being conducted using optical 10-meter-class telescopes, such as the Gran Telescopio Canarias (GTC), and multi-wavelength studies are focused on constructing the SEDs of these objects with the aim of providing an overall view of their emission and of gaining insights into the underlying physical processes (Paiano et al. 2017d, 2019, and in prep.; Ulgiati et al. 2024, and in prep.).
This paper is one piece of the global puzzle in the study of extragalactic UGSs and will help shed light on these γ-ray emitters. New blazars and AGNs are discovered, which further enriches our understanding of their population characteristics and how they fit into the larger framework of AGNs and their varied emission processes.
As a final remark, this paper presents a comprehensive list of potential lower-energy counterparts (X-ray, optical, and radio) to extragalactic UGSs (|b|> 10°) from the Fermi 4FGL-DR4 catalogue. The search for counterparts began in the X-ray band by analysing Swift/XRT observations that covered the UGS regions. Of the 714 observed UGSs, 274 have at least one X-ray source within the 3σFermi error box, with a signal-to-noise ratio (S/N) ≥ 3. Of these, 193 have only one possible X-ray counterpart (denoted as UGS1), and 81 have multiple possible X-ray counterparts (denoted as UGS2).
All 193 X-ray counterparts of UGS1 are coincident with optical sources, 113 of which are also coincident with radio sources. All X-ray sources coincident with a radio source from the VLASS and RACS catalogues for which optical magnitudes in the g-band were available are radio loud, except for 4FGL J0641.4+3349/PAN J064111.22+334459.7, which has an R value of 2. The UGS1 sources that are not coincident with radio objects are likely radio-quiet sources. A subset of these sources was observed using the ATCA facility, and although several were detected, they are still confirmed to be radio quiet.
Similarly to UGS1, all potential X-ray counterparts of UGS2 sample that coincide with a radio source catalogued in VLASS or RACS for which g-band optical magnitudes are available are found to be radio loud, except for 4FGL J0159.0+3313/XRT J015905.35+331257.8, 4FGL J1008.2−1000/XRT J100848.62−095450.2, and 4FGL J1407.7−3017/XRT J140806.82−302353.7. More studies of the broadband properties of these two sources are therefore needed to constrain their nature.
Finally, it was noted that UGSs exhibit a lower flux across all bands compared to sources that were associated and identified in the 4FGL-DR4 catalogue. Using colour-colour diagrams, log(Fradio/FX) and log(Foptical/FX) as functions of log(Fγ/FX), we observed that both UGS1 and UGS2 sources that are coincident with radio sources occupy the same regions of the diagram as blazars (or generally, radio-loud AGNs). The remaining UGS1 sources that are not coincident with radio objects occupy a distinct region populated by mainly radio-quiet AGNs (see Ulgiati et al. 2024). UGS2 sources that are not coincident with radio objects occupy a less well constrained region because the degeneracy level is high, as is the likelihood of spurious sources.
Furthermore, as observed in the IR colour-colour diagrams [3.4]–[4.6]–[12]–[22] μm, the radio-loud UGS objects overlap with the WISE blazar strip defined in Massaro et al. (2016, and references therein). This further supports the hypothesis that they are good blazar candidates. However, definitive confirmation will be provided by optical spectroscopy, which will help us to better constrain their classification and confirm the blazar nature of the candidates.
Data availability
The appendices for this article are available at Zenodo: https://zenodo.org/records/14543340
The full versions of Tables 1–6 are available at the CDS via anonymous ftp to cdsarc.cds.unistra.fr (130.79.128.5) or via https://cdsarc.cds.unistra.fr/viz-bin/cat/J/A+A/694/A176
Acknowledgments
FP acknowledges support from INAF Grant OBIWAN. CP acknowledges support from PRIN MUR SEAWIND (2022Y2T94C) funded by European Union – NextGenerationEU and INAF Grant BLOSSOM. MDS aknowledges support from INAF Grant ACEB-BANANA. This work has been partially supported by the ASI-INAF program I/004/11/6.
References
- Abbott, T. M. C., Adamów, M., Aguena, M., et al. 2021, ApJS, 255, 20 [NASA ADS] [CrossRef] [Google Scholar]
- Abdo, A. A., Ackermann, M., Ajello, M., et al. 2010, Science, 328, 725 [NASA ADS] [CrossRef] [Google Scholar]
- Abdo, A. A., Ajello, M., Allafort, A., et al. 2013, ApJS, 208, 17 [Google Scholar]
- Abdollahi, S., Acero, F., Ackermann, M., et al. 2020, ApJS, 247, 33 [Google Scholar]
- Abdollahi, S., Acero, F., Baldini, L., et al. 2022, ApJS, 260, 53 [NASA ADS] [CrossRef] [Google Scholar]
- Acciari, V. A., Ansoldi, S., Antonelli, L. A., et al. 2019, MNRAS, 486, 4233 [NASA ADS] [CrossRef] [Google Scholar]
- Acero, F., Donato, D., Ojha, R., et al. 2013, ApJ, 779, 133 [Google Scholar]
- Acero, F., Ackermann, M., Ajello, M., et al. 2015, ApJS, 218, 23 [Google Scholar]
- Ackermann, M., Ajello, M., Allafort, A., et al. 2011, ApJ, 741, 30 [NASA ADS] [CrossRef] [Google Scholar]
- Ackermann, M., Ajello, M., Allafort, A., et al. 2012, ApJ, 753, 83 [NASA ADS] [CrossRef] [Google Scholar]
- Ahumada, R., Allende Prieto, C., Almeida, A., et al. 2020, ApJS, 249, 3 [NASA ADS] [CrossRef] [Google Scholar]
- Ajello, M., Romani, R. W., Gasparrini, D., et al. 2014, ApJ, 780, 73 [Google Scholar]
- Angioni, R., Grandi, P., Torresi, E., Vignali, C., & Knödlseder, J. 2017, AIP Conf. Ser., 1792, 050006 [Google Scholar]
- Arnaud, K. 2022, AAS/High Energy Astrophysics Division, 54, 203.02 [Google Scholar]
- Arnaud, K. A. 1996, ASP Conf. Ser., 101, 17 [Google Scholar]
- Atwood, W. B., Abdo, A. A., Ackermann, M., et al. 2009, ApJ, 697, 1071 [CrossRef] [Google Scholar]
- Ballet, J., Bruel, P., Burnett, T. H., Lott, B., & The Fermi-LAT Collaboration 2023, ArXiv e-prints [arXiv:2307.12546] [Google Scholar]
- Bruzewski, S., Schinzel, F. K., Taylor, G. B., & Petrov, L. 2021, ApJ, 914, 42 [NASA ADS] [CrossRef] [Google Scholar]
- Bruzewski, S., Schinzel, F. K., Taylor, G. B., & Petrov, L. 2022, VizieR Online Data Catalog: J/ApJ/914/42 [Google Scholar]
- Cerruti, M. 2020, J. Phys. Conf. Ser., 1468, 012094 [NASA ADS] [CrossRef] [Google Scholar]
- Cerruti, M., Zech, A., Boisson, C., & Inoue, S. 2015, MNRAS, 448, 910 [Google Scholar]
- Chambers, K. C., Magnier, E. A., Metcalfe, N., et al. 2016, ArXiv e-prints [arXiv:1612.05560] [Google Scholar]
- Cheung, C. C., & Fermi LAT Collaboration 2010, AAS/High Energy Astrophysics Division, 11, 30 [Google Scholar]
- Costamante, L. 2020, Multifrequency Behaviour of High Energy Cosmic Sources – XIII, 3–8 June 2019, Palermo, 35 [Google Scholar]
- Costamante, L., Cutini, S., Tosti, G., Antolini, E., & Tramacere, A. 2018, MNRAS, 477, 4749 [Google Scholar]
- D’Abrusco, R., Massaro, F., Paggi, A., et al. 2013, ApJS, 206, 12 [CrossRef] [Google Scholar]
- di Mauro, M. 2018, in Fourteenth Marcel Grossmann Meeting – MG14, eds. M. Bianchi, R. T. Jansen, & R. Ruffini, 3098 [Google Scholar]
- Doert, M., & Errando, M. 2014, ApJ, 782, 41 [NASA ADS] [CrossRef] [Google Scholar]
- Evans, P. A., Beardmore, A. P., Page, K. L., et al. 2009, MNRAS, 397, 1177 [Google Scholar]
- Evans, P. A., Page, K. L., Osborne, J. P., et al. 2020, ApJS, 247, 54 [Google Scholar]
- Falcone, A., Stroh, M., Ferrara, E., et al. 2011, AAS/High Energy Astrophysics Division, 12, 4.03 [Google Scholar]
- Falcone, A., Stroh, M., & Pryal, M. 2014, American Astronomical Society Meeting Abstracts, 223, 301.05 [Google Scholar]
- Falomo, R., Pian, E., & Treves, A. 2014, A&ARv, 22, 73 [NASA ADS] [CrossRef] [Google Scholar]
- Fronte, L., Mazzon, B., Metruccio, F., et al. 2023, J. Phys. Conf. Ser., 2429, 012045 [NASA ADS] [CrossRef] [Google Scholar]
- Gao, S., Fedynitch, A., Winter, W., & Pohl, M. 2019, Nat. Astron., 3, 88 [NASA ADS] [CrossRef] [Google Scholar]
- Gehrels, N., Chincarini, G., Giommi, P., et al. 2004, ApJ, 611, 1005 [Google Scholar]
- Ghisellini, G., Righi, C., Costamante, L., & Tavecchio, F. 2017, MNRAS, 469, 255 [NASA ADS] [CrossRef] [Google Scholar]
- Giommi, P., Padovani, P., & Polenta, G. 2013, MNRAS, 431, 1914 [CrossRef] [Google Scholar]
- Goad, M. R., Osborne, J. P., Beardmore, A. P., & Evans, P. A. 2007, GRB Coordinates Network, 7133, 1 [NASA ADS] [Google Scholar]
- Grandi, P. 2012, Int. J. Mod. Phys. Conf. Ser., 8, 25 [CrossRef] [Google Scholar]
- Hale, C. L., McConnell, D., Thomson, A. J. M., et al. 2021, PASA, 38, e058 [NASA ADS] [CrossRef] [Google Scholar]
- Hambly, N., Read, M., Mann, R., et al. 2004, ASP Conf. Ser., 314, 137 [NASA ADS] [Google Scholar]
- HI4PI Collaboration (Ben Bekhti, N., et al.) 2016, A&A, 594, A116 [NASA ADS] [CrossRef] [EDP Sciences] [Google Scholar]
- Järvelä, E., Berton, M., & Crepaldi, L. 2021, Front. Astron. Space Sci., 8, 147 [CrossRef] [Google Scholar]
- Jones, D. H., Read, M. A., Saunders, W., et al. 2009, MNRAS, 399, 683 [Google Scholar]
- Kaur, A., Falcone, A. D., & Stroh, M. 2019a, AAS/High Energy Astrophysics Division, 17, 106.09 [Google Scholar]
- Kaur, A., Falcone, A. D., Stroh, M. D., Kennea, J. A., & Ferrara, E. C. 2019b, ApJ, 887, 18 [NASA ADS] [CrossRef] [Google Scholar]
- Kaur, A., Kerby, S., & Falcone, A. D. 2023, ApJ, 943, 167 [Google Scholar]
- Kellermann, K. I., Sramek, R., Schmidt, M., Shaffer, D. B., & Green, R. 1989, AJ, 98, 1195 [Google Scholar]
- Kerby, S., Kaur, A., Falcone, A. D., et al. 2021, ApJ, 923, 75 [NASA ADS] [CrossRef] [Google Scholar]
- Lacy, M., Baum, S. A., Chandler, C. J., et al. 2020, PASP, 132, 035001 [Google Scholar]
- Landi, R., Bassani, L., Stephen, J. B., et al. 2015, A&A, 581, A57 [NASA ADS] [CrossRef] [EDP Sciences] [Google Scholar]
- Li, K.-L., Hou, X., Strader, J., et al. 2018, ApJ, 863, 194 [NASA ADS] [CrossRef] [Google Scholar]
- Malizia, A., Bassani, L., Bazzano, A., et al. 2012, MNRAS, 426, 1750 [Google Scholar]
- Mao, Z., & Yu, Y.-W. 2013, RAA, 13, 952 [NASA ADS] [Google Scholar]
- Marchesini, E. J., Paggi, A., Massaro, F., et al. 2020, A&A, 638, A128 [NASA ADS] [CrossRef] [EDP Sciences] [Google Scholar]
- Massaro, F., Landoni, M., D’Abrusco, R., et al. 2015, A&A, 575, A124 [NASA ADS] [CrossRef] [EDP Sciences] [Google Scholar]
- Massaro, F., Álvarez Crespo, N., D’Abrusco, R., et al. 2016, Ap&SS, 361, 337 [Google Scholar]
- Mirabal, N., Frías-Martinez, V., Hassan, T., & Frías-Martinez, E. 2012, MNRAS, 424, L64 [NASA ADS] [CrossRef] [Google Scholar]
- Monroe, T. R., Prochaska, J. X., Tejos, N., et al. 2016, AJ, 152, 25 [NASA ADS] [CrossRef] [Google Scholar]
- NASA High Energy Astrophysics Science Archive Research Center 2014, Astrophysics Source Code Library [record ascl:1408.004] [Google Scholar]
- Nolan, P. L., Abdo, A. A., Ackermann, M., et al. 2012, ApJS, 199, 31 [Google Scholar]
- Nori, M., Giroletti, M., Massaro, F., et al. 2014, ApJS, 212, 3 [Google Scholar]
- Padovani, P., Alexander, D. M., Assef, R. J., et al. 2017, A&ARv, 25, 2 [Google Scholar]
- Paiano, S., Franceschini, A., & Stamerra, A. 2017a, MNRAS, 468, 4902 [Google Scholar]
- Paiano, S., Landoni, M., Falomo, R., et al. 2017b, ApJ, 837, 144 [Google Scholar]
- Paiano, S., Landoni, M., Falomo, R., Treves, A., & Scarpa, R. 2017c, ApJ, 844, 120 [NASA ADS] [CrossRef] [Google Scholar]
- Paiano, S., Falomo, R., Franceschini, A., Treves, A., & Scarpa, R. 2017d, ApJ, 851, 135 [NASA ADS] [CrossRef] [Google Scholar]
- Paiano, S., Falomo, R., Treves, A., Franceschini, A., & Scarpa, R. 2019, ApJ, 871, 162 [NASA ADS] [CrossRef] [Google Scholar]
- Paiano, S., Falomo, R., Treves, A., & Scarpa, R. 2020, MNRAS, 497, 94 [CrossRef] [Google Scholar]
- Paiano, S., Falomo, R., Treves, A., et al. 2021, MNRAS, 504, 3338 [NASA ADS] [CrossRef] [Google Scholar]
- Paiano, S., Falomo, R., Treves, A., et al. 2023, MNRAS, 521, 2270 [NASA ADS] [CrossRef] [Google Scholar]
- Paliya, V. S., Stalin, C. S., & Ravikumar, C. D. 2015, AJ, 149, 41 [Google Scholar]
- Petrov, L., Mahony, E. K., Edwards, P. G., et al. 2013, MNRAS, 432, 1294 [NASA ADS] [CrossRef] [Google Scholar]
- Rieger, F. M. 2017, AIP Conf. Ser., 1792, 020008 [Google Scholar]
- Rodrigues, X., Gao, S., Fedynitch, A., Palladino, A., & Winter, W. 2019, ApJ, 874, L29 [NASA ADS] [CrossRef] [Google Scholar]
- Salvetti, D., Chiaro, G., La Mura, G., & Thompson, D. J. 2017a, MNRAS, 470, 1291 [NASA ADS] [CrossRef] [Google Scholar]
- Salvetti, D., Mignani, R. P., De Luca, A., et al. 2017b, MNRAS, 470, 466 [NASA ADS] [CrossRef] [Google Scholar]
- Schinzel, F. K., Petrov, L., Taylor, G. B., et al. 2015, ApJS, 217, 4 [NASA ADS] [CrossRef] [Google Scholar]
- Schinzel, F. K., Petrov, L., Taylor, G. B., & Edwards, P. G. 2017, ApJ, 838, 139 [CrossRef] [Google Scholar]
- Seabroke, G. M., Fabricius, C., Teyssier, D., et al. 2021, A&A, 653, A160 [NASA ADS] [CrossRef] [EDP Sciences] [Google Scholar]
- Shaw, M. S., Romani, R. W., Cotter, G., et al. 2012, ApJ, 748, 49 [CrossRef] [Google Scholar]
- Shaw, M. S., Romani, R. W., Cotter, G., et al. 2013, ApJ, 764, 135 [NASA ADS] [CrossRef] [Google Scholar]
- Shimwell, T. W., Hardcastle, M. J., Tasse, C., et al. 2022, A&A, 659, A1 [NASA ADS] [CrossRef] [EDP Sciences] [Google Scholar]
- Stickel, M., Padovani, P., Urry, C. M., Fried, J. W., & Kuehr, H. 1991, ApJ, 374, 431 [Google Scholar]
- Stocke, J. T., Morris, S. L., Gioia, I. M., et al. 1991, ApJS, 76, 813 [Google Scholar]
- Stroh, M. C., & Falcone, A. D. 2013, ApJS, 207, 28 [NASA ADS] [CrossRef] [Google Scholar]
- Takahashi, Y., Kataoka, J., Nakamori, T., et al. 2012, ApJ, 747, 64 [Google Scholar]
- Ulgiati, A., Paiano, S., Treves, A., et al. 2024, MNRAS, 530, 4626 [NASA ADS] [CrossRef] [Google Scholar]
- Urry, C. M., & Padovani, P. 1995, PASP, 107, 803 [NASA ADS] [CrossRef] [Google Scholar]
- Véron-Cetty, M. P., & Véron, P. 2006, A&A, 455, 773 [Google Scholar]
- Webb, N. A., Coriat, M., Traulsen, I., et al. 2020, A&A, 641, A136 [NASA ADS] [CrossRef] [EDP Sciences] [Google Scholar]
- Wilms, J., Allen, A., & McCray, R. 2000, ApJ, 542, 914 [Google Scholar]
- Wright, E. L., Eisenhardt, P. R. M., Mainzer, A. K., et al. 2010, AJ, 140, 1868 [Google Scholar]
- Wu, H. K. J. 2018, Ph.D. Thesis, Rheinische Friedrich Wilhelms University of Bonn, Germany [Google Scholar]
- Ye, X.-H., Zeng, X.-T., Huang, D.-Y., et al. 2023, PASP, 135, 014101 [CrossRef] [Google Scholar]
All Tables
All Figures
|
Fig. 1. X-ray sky map of 4FGL J2207.1+2222 (upper panel) and 4FGL J2212.9+7921 (bottom panel). The yellow and cyan ellipses indicate the 2σ and 3σFermiγ-ray error regions, respectively. The X-ray detection is shown with a green circular region. |
| In the text | |
|
Fig. 2. Absorbed 0.3−10 keV flux distributions for UGS1 and UGS2. Sources with proper motion are excluded from the histograms. |
| In the text | |
|
Fig. 3. Optical r-band PanSTARRs image of the 4FGL J2207.1+2222 counterpart (upper panel) and the 4FGL J0026.1−0732 counterpart (bottom panel). The green circle represents the error box of the X-ray counterpart, and the red ellipses show the error box of radio counterparts found within the VLASS catalogue. |
| In the text | |
|
Fig. 4. Distribution of magnitudes in the g (top) and r band (bottom) for UGS1. Sources with proper motion have been excluded from the histogram. |
| In the text | |
|
Fig. 5. Distribution of the radio-loudness parameter (log(R)) value for 1409 objects classified as BLL and 771 objects as FSRQ of the 4LAC catalogue (upper panel) and for the counterparts of UGS1 (lower panel). The empty orange bars represent the upper limits on R for UGS1 without a radio counterpart. The dashed vertical black line represents the radio-loudness parameter value (R = 10) that separates the radio-quiet from the radio-loud sources. Sources with proper motion are excluded from the histograms. |
| In the text | |
|
Fig. 6. Absorbed 0.3−10 keV flux distributions for UGS1 (top), 4FGL-DR4 BLL (centre) and 4FGL-DR4 FSRQ (bottom). Sources with proper motion are excluded from the histograms. |
| In the text | |
|
Fig. 7. log(Fradio/FX) vs log(Fγ/FX) (top) and log(Foptical/FX) vs log(Fγ/FX) (bottom) diagrams and for 4FGL-DR4 BLL (light grey), 4FGL-DR4 FSRQ (grey), UGS1 (red), and 4FGL-DR4 Galactic sources (blue). The sources that were analysed in Ulgiati et al. (2024) are underlined with a black edge around the points. Sources with proper motion or without g-band magnitude estimates are not included in the plot. |
| In the text | |
|
Fig. 8. log(Fradio/FX) vs log(Fγ/FX) (top) and log(Foptical/FX) vs log(Fγ/FX) (bottom) diagrams and for 4FGL-DR4 BLL (light grey), 4FGL-DR4 FSRQ (grey), UGS2 (red), and 4FGL-DR4 Galactic sources (blue). Sources with proper motion, without an optical counterpart, or without g-band magnitude estimates are not included in the plot. |
| In the text | |
|
Fig. 9. [3.4]–[4.6]–[12] μm (top), [4.6]–[12]–[22] μm (centre) and [3.4]–[4.6]–[12]–[22] μm (bottom) IR colour diagrams for 4FGL-DR4 BLL (light grey), 4FGL-DR4 FSRQ (grey), and radio-loud UGS1 (red). Sources with proper motion are excluded from the histograms. |
| In the text | |
|
Fig. 10. [3.4]–[4.6]–[12] μm (top), [4.6]–[12]–[22] μm (centre) and [3.4]–[4.6]–[12]–[22] μm (bottom) IR colour diagrams for 4FGL-DR4 BLL (light grey), 4FGL-DR4 FSRQ (grey), and radio-loud UGS2 (blue). Sources with proper motion are excluded from the histograms. |
| In the text | |
Current usage metrics show cumulative count of Article Views (full-text article views including HTML views, PDF and ePub downloads, according to the available data) and Abstracts Views on Vision4Press platform.
Data correspond to usage on the plateform after 2015. The current usage metrics is available 48-96 hours after online publication and is updated daily on week days.
Initial download of the metrics may take a while.